. 2014 Aug 21;9(8):e105603.
doi: 10.1371/journal.pone.0105603. eCollection 2014.

Anti-obesity effects of granulocyte-colony stimulating factor in Otsuka-Long-Evans-Tokushima fatty rats

Affiliations

Anti-obesity effects of granulocyte-colony stimulating factor in Otsuka-Long-Evans-Tokushima fatty rats

Yonggu Lee et al. PLoS One. .

Abstract

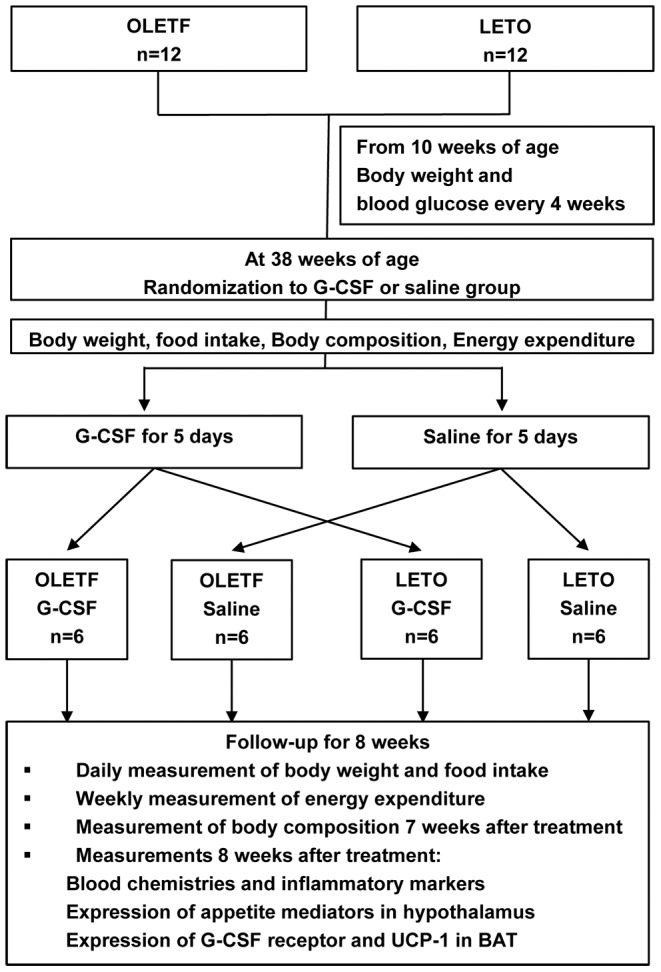
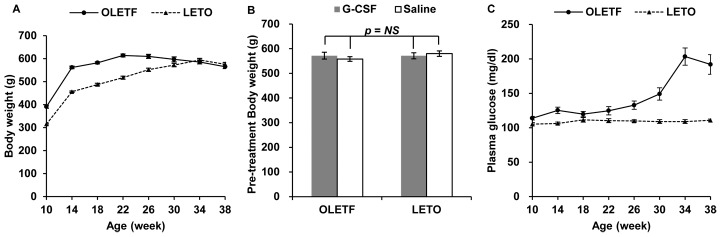
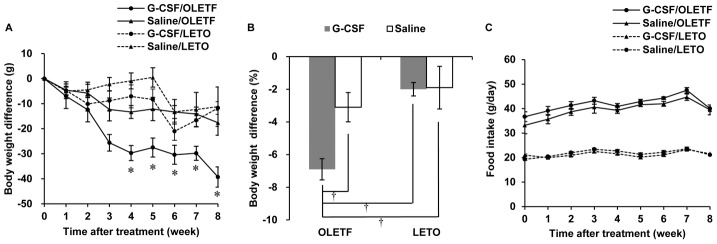
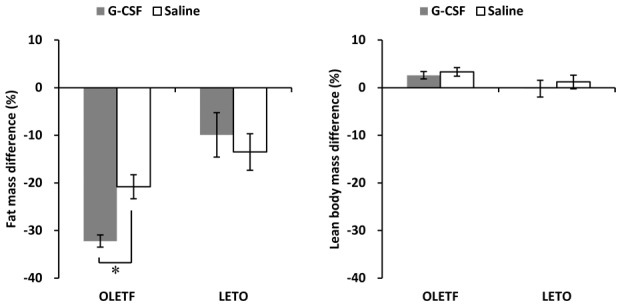
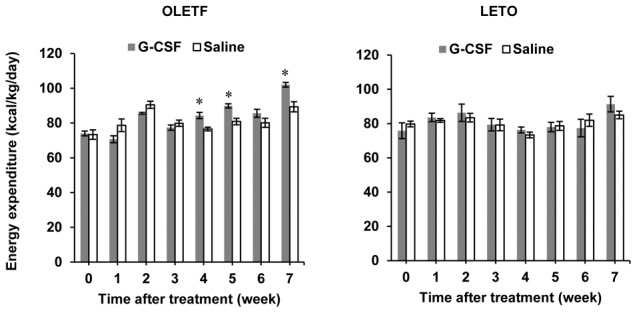
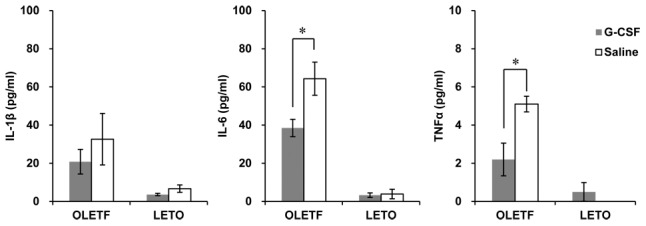
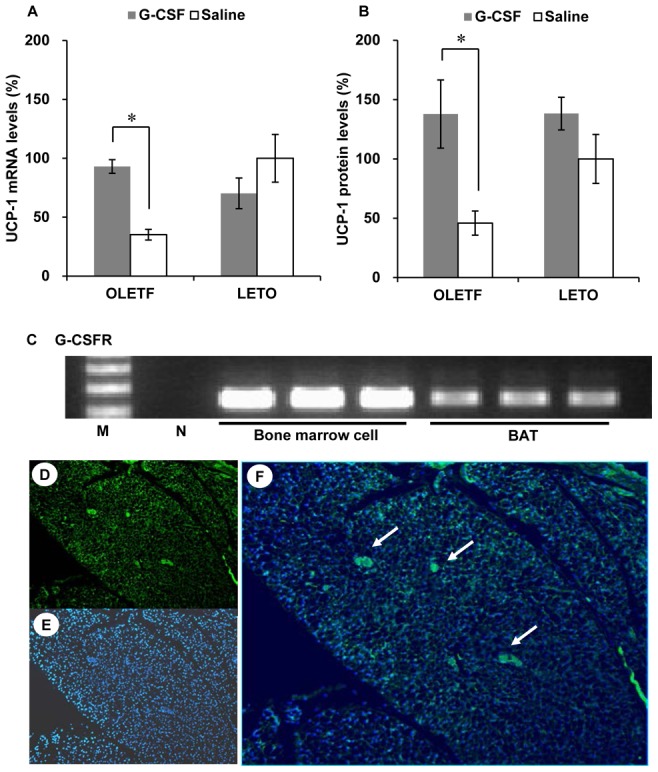
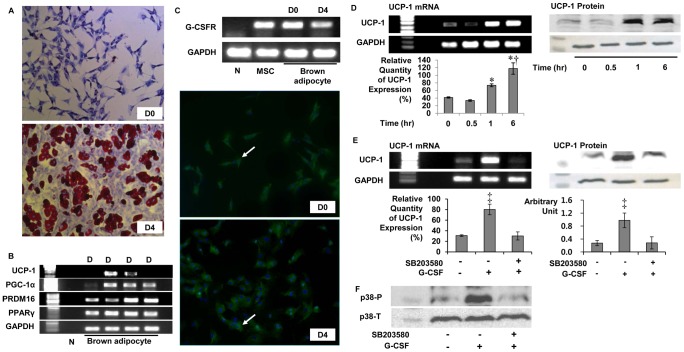
Granulocyte-colony stimulating factor (G-CSF) has molecular structures and intracellular signaling pathways that are similar to those of leptin and ciliary neurotropic factor (CNTF). It also has immune-modulatory properties. Given that leptin and CNTF play important roles in energy homeostasis and that obesity is an inflammatory condition in adipose tissue, we hypothesized that G-CSF could also play a role in energy homeostasis. We treated 12 38-week-old male Otsuka-Long-Evans-Tokushima fatty rats (OLETF, diabetic) and 12 age-matched male Long-Evans-Tokushima rats (LETO, healthy) with 200 µg/day G-CSF or saline for 5 consecutive days. Body weight reduction was greater in G-CSF-treated OLETF (G-CSF/OLETF) than saline-treated OLETF (saline/OLETF) following 8 weeks of treatment (-6.9±1.6% vs. -3.1±2.2%, p<0.05). G-CSF treatment had no effect on body weight in LETO or on food intake in either OLETF or LETO. Body fat in G-CSF/OLETF was more reduced than in saline/OLETF (-32.2±3.1% vs. -20.8±6.2%, p<0.05). Energy expenditure was higher in G-CSF/OLETF from 4 weeks after the treatments than in saline/OLETF. Serum levels of cholesterol, triglyceride, interleukin-6 and tumor necrosis factor-α were lower in G-CSF/OLETF than in saline/OLETF. Uncoupling protein-1 (UCP-1) expression in brown adipose tissue (BAT) was higher in G-CSF/OLETF than in saline/OLETF, but was unaffected in LETO. Immunofluorescence staining and PCR results revealed that G-CSF receptors were expressed in BAT. In vitro experiments using brown adipocyte primary culture revealed that G-CSF enhanced UCP-1 expression from mature brown adipocytes via p38 mitogen-activated protein kinase pathway. In conclusion, G-CSF treatment reduced body weight and increased energy expenditure in a diabetic model, and enhanced UCP-1 expression and decreased inflammatory cytokine levels may be associated with the effects of G-CSF treatment.


Conflict of interest statement

Competing Interests: The authors have declared that no competing interests exist.

Figures

Figure 1
Figure 1. Schematic description of the experimental protocol.
Twelve OLETF and 12 LETO rats were prepared at 10 weeks of age and randomized into either a G-CSF or saline treatment group. All animals were treated with G-CSF or saline for 5 consecutive days and were followed for 8 weeks. Body composition was measured using dual energy X-ray absorptiometry, and energy expenditure was measured with an indirect calorimeter. OLETF, Otsuka Long-Evans Tokushima Fatty rats; LETO, Long-Evans Tokushima Otsuka rats; G-CSF, granulocyte-colony stimulating factor; UCP-1 uncoupling protein-1; BAT, brown adipose tissue.
Figure 2
Figure 2. Body weight and blood glucose levels before G-CSF or saline treatment.
(A) Body weights of the OLETF rats peaked at 22 weeks of age, then gradually decreased and were not significantly different with those of the LETO rats around 34 weeks of age; (B) Pre-treatment body weights at 38 weeks of age were not significantly different in all animal groups; (C) Blood glucose levels after 8 hours of fasting indicate the OLETF rats showed an overt diabetic phenotype after 30 weeks of age. - The data was presented as the mean ± S.E.M. OLETF, Otsuka Long-Evans Tokushima Fatty rats; LETO, Long-Evans Tokushima Otsuka rats; NS, not significant.
Figure 3
Figure 3. Changes in body weight and food intake after G-CSF or saline treatment.
(A) Body weight difference from the pre-treatment body weight. Gradual decrease in body weight was shown in all animal groups, but the body weight reduction was significantly larger in G-CSF/OLETF than those in Saline/OLETF. The body weight reduction was not significantly different between G-CSF/LETO and Saline/LETO; (B) The percentage of body weight reduction in 8 weeks after the treatments was higher in G-CSF/OLETF than those in the other animal group; (C) The food intake was not significantly different between the G-CSF-treated groups and saline-treated groups of LETO and OLETF. * p<0.05 vs. saline/OLETF; † p<0.05 vs. other groups; - The data are shown as the mean ± S.E.M. G-CSF/OLETF, G-CSF-treated OLEFT; Saline/OLETF, saline-treated OLETF; G-CSF/LETO, G-CSF-treated LETO; Saline/LETO, saline-treated LETO; G-CSF, granulocyte colony-stimulating factor; OLETF, Otsuka Long-Evans Tokushima Fatty rats; LETO, Long-Evans Tokushima Otsuka rats.
Figure 4
Figure 4. Changes in body composition.
The fat mass reduction was significantly larger in G-CSF-treated OLETF than that in saline-treated OLETF, while was not different between G-CSF-treated LETO and saline-treated LETO. The lean body mass differences were not significantly different in all animal groups. * p<0.05; - The data were shown as the mean ± S.E.M. - Body composition was measured 1 week before (pre-treatment) and 7 weeks after (post-treatment) G-CSF or saline treatment. - Percentage differences are shown as the difference between the pre-treatment value and post-treatment value divided by the pre-treatment value. G-CSF, granulocyte colony-stimulating factor; OLETF, Otsuka Long-Evans Tokushima Fatty rats; LETO, Long-Evans Tokushima Otsuka rats.
Figure 5
Figure 5. Energy expenditure after G-CSF and saline treatment.
Energy expenditure in the G-CSF-treated OLETF rats was greater than in the saline-treated OLETF rats at 4, 5, and 7 weeks after treatment. Energy expenditure in the G-CSF-treated LETO was not different than that in the saline-treated LETO up to 7 weeks after the treatments. * p<0.05 vs. the saline-treated group. - The data were shown as the mean ± S.E.M. - Energy expenditure was measured with an indirect calorimeter. G-CSF, granulocyte colony-stimulating factor; OLETF, Otsuka Long-Evans Tokushima Fatty rats; LETO, Long-Evans Tokushima Otsuka rats.
Figure 6
Figure 6. Serum inflammatory cytokines after treatment with G-CSF or saline.
The IL-1β, IL-6 and TNFα levels were higher in OLETF than those in LETO in both treatments group. Serum levels of IL-6 and TNFα in the G-CSF-treated OLETF rats are significantly higher than in the saline-treated OLETF rats. There is no significant difference between serum levels of the cytokines in the G-CSF-treated group and those in the saline-treated group of LETO rats. * p<0.05; - The data were presented as the mean ± S.E.M. IL-1β, interleukin-1β; IL-6, interleukin-6; TNFα, tumor necrosis factor α; G-CSF, granulocyte colony-stimulating factor; OLETF, Otsuka Long-Evans Tokushima Fatty rats; LETO, Long-Evans Tokushima Otsuka rats.
Figure 7
Figure 7. Hypothalamic expression of appetite mediators.
The mRNA levels of NPY were not different between the two groups of OLETF, while significantly higher in G-CSF-treated LETO than those in saline-treated LETO. The mRNA levels of POMC were significantly higher in G-CSF-treated groups than those in saline-treated groups in both OLETF and LETO. The mRNA levels of AgRP and CART were not different between G-CSF-treated groups and saline-treated groups in both OLETF and LETO. * p<0.05. - The data were presented as the mean ± S.E.M. - The hypothalamic expression of POMC in the G-CSF-treated OLETF. - All measurements were duplicated, and the mRNA levels were normalized against those of the saline-treated LETO rats. NPY, neuropeptide Y; POMC, pro-opiomelanocortin; AgRP, agouti-related peptide; CART, cocaine-amphetamine regulated transcript; G-CSF, granulocyte colony-stimulating factor; OLETF, Otsuka Long-Evans Tokushima Fatty rats; LETO, Long-Evans Tokushima Otsuka rats.
Figure 8
Figure 8. UCP-1 and G-CSFR expression in BAT.
(A) UCP-1 mRNA levels are higher in the G-CSF-treated OLETF than those in the saline-treated OLETF. UCP-1 mRNA levels are unaffected by G-CSF treatment in LETO; (B) UCP-1 protein levels are higher in the G-CSF-treated OLETF than those in the saline-treated OLETF. UCP-1 protein levels are unaffected by G-CSF treatment in LETO; (C) RT-PCR results show the presence of G-CSFR in BAT; (D), (E) and (F) Immunofluorescence staining revealed that G-CSFR was presented in the islands of brown adipocytes (white arrows) (D, immunofluorescence staining for G-CSFR, 200; E, DAPI, 200; F, merged, 200). * p<0.05. - The data were presented as the mean ± S.E.M. - Measurements of UCP-1 mRNA levels were duplicated, and the mRNA levels were normalized against those of the saline-treated LETO rats. - UCP-1 protein levels were normalized against those of the saline-treated LETO rats. UCP-1, uncoupling protein-1; G-CSFR, G-CSF receptor; BAT, brown adipose tissue.
Figure 9
Figure 9. UCP-1 expression in primary cultured brown adipocytes by G-CSF via p38 MAPK pathway.
(A) Oil red-O staining for brown adipocytes; (B) Indictors for differentiation of brown adipocytes. UCP-1 were expressed from D2 to D4 and the band density were decreased on D4; (C) mRNA expression and immunofluorescence staining of G-CSFR in primary cultured brown adipocytes. Cytoplasm was stained by G-CSFR specific antibodies (white arrow); (D) UCP-1 mRNA and protein expression in mature brown adipocytes on D4. After 1 hour from G-CSF treatment, UCP-1 expressions were significantly enhanced. (E) UCP-1 mRNA and protein expression was enhanced after G-CSF treatment and repressed after G-CSF treatment when brown adipocytes were pretreated with SB203580 (p38 MAPK inhibitor); (F) p38 MAPK phosphorylation was enhanced 30 minutes after G-CSF treatment and repressed by SB203580 pretreatment. * p<0.05 vs. UCP-1 level at 0 hour; † p<0.05 vs. UCP-1 levels at 1 hour; ‡ p<0.05 vs. the others. - The relative quantities of UCP-1 mRNA were measured 5 times and averaged. D(n), n days after differentiation; G-CSFR, Granulocyte colony-stimulating factor receptor; GAPDH, Glyceraldehyde 3-phosphate dehydrogenase; MSC; Bone marrow derived mesenchymal stem cell; UCP-1, Uncoupling protein-1; PPAR Peroxisome proliferator-activated receptor; PGC-1α, PPAR γ co-activator 1-α; SB203580; p38 Mitogen-activated protein kinase inhibitor; p38 MAPK, p38 Mitogen-activated protein kinase; p38-P, phosphorylated form of p38 MAPK; p38-T, total form of p38 MAPK.

References

    1. Panopoulos AD, Watowich SS (2008) Granulocyte colony-stimulating factor: molecular mechanisms of action during steady state and ‘emergency’ hematopoiesis. Cytokine 42: 277–288. - PMC - PubMed
    1. Huising MO, Kruiswijk CP, Flik G (2006) Phylogeny and evolution of class-I helical cytokines. J Endocrinol 189: 1–25. - PubMed
    1. Watt MJ, Dzamko N, Thomas WG, Rose-John S, Ernst M, et al. (2006) CNTF reverses obesity-induced insulin resistance by activating skeletal muscle AMPK. Nat Med 12: 541–548. - PubMed
    1. Febbraio MA (2007) gp130 receptor ligands as potential therapeutic targets for obesity. J Clin Invest 117: 841–849. - PMC - PubMed
    1. Reed JA, Clegg DJ, Smith KB, Tolod-Richer EG, Matter EK, et al. (2005) GM-CSF action in the CNS decreases food intake and body weight. J Clin Invest 115: 3035–3044. - PMC - PubMed

MeSH terms