. 2014 Aug 21;10(8):e1004323.
doi: 10.1371/journal.ppat.1004323. eCollection 2014 Aug.

On the front line: quantitative virus dynamics in honeybee (Apis mellifera L.) colonies along a new expansion front of the parasite Varroa destructor

Affiliations

On the front line: quantitative virus dynamics in honeybee (Apis mellifera L.) colonies along a new expansion front of the parasite Varroa destructor

Fanny Mondet et al. PLoS Pathog. .

Abstract

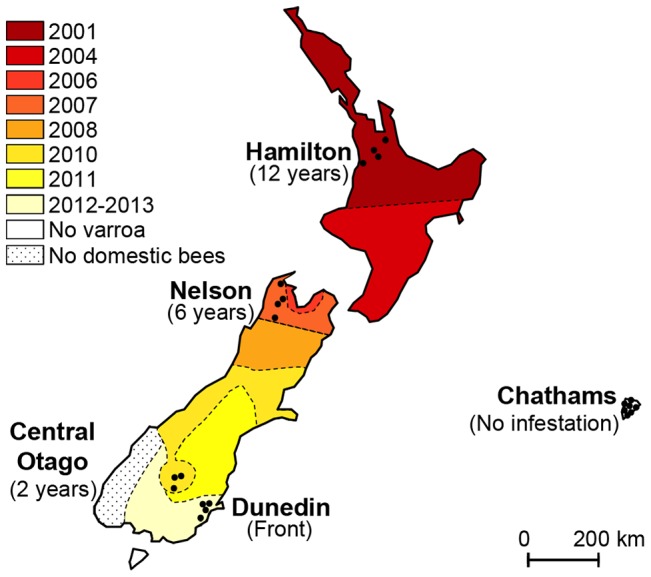
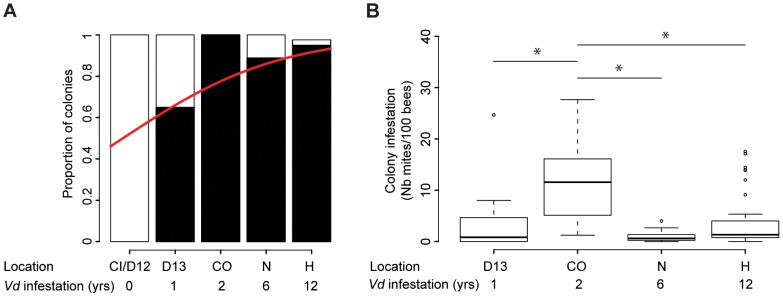
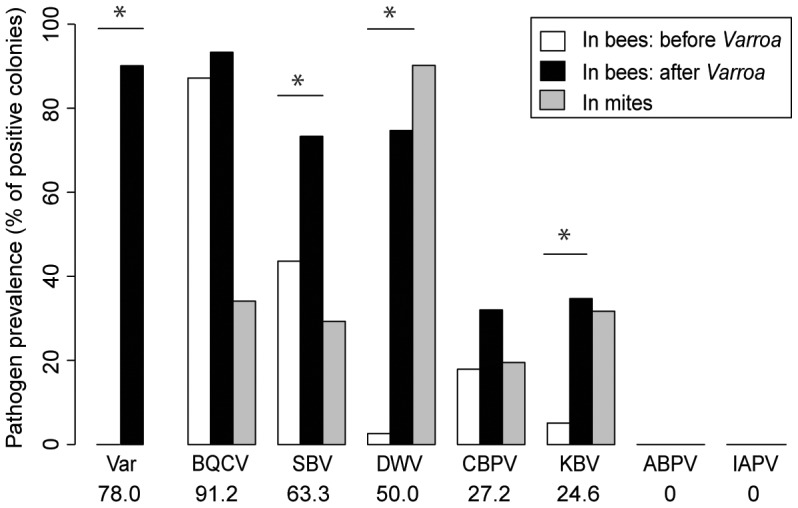
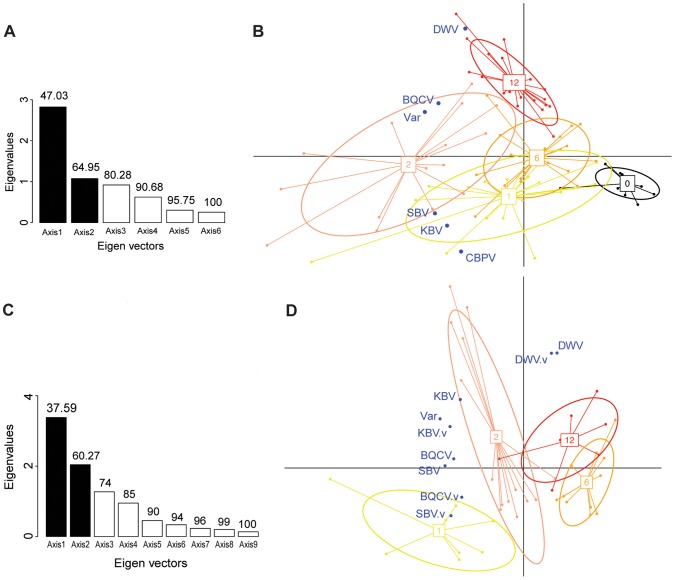
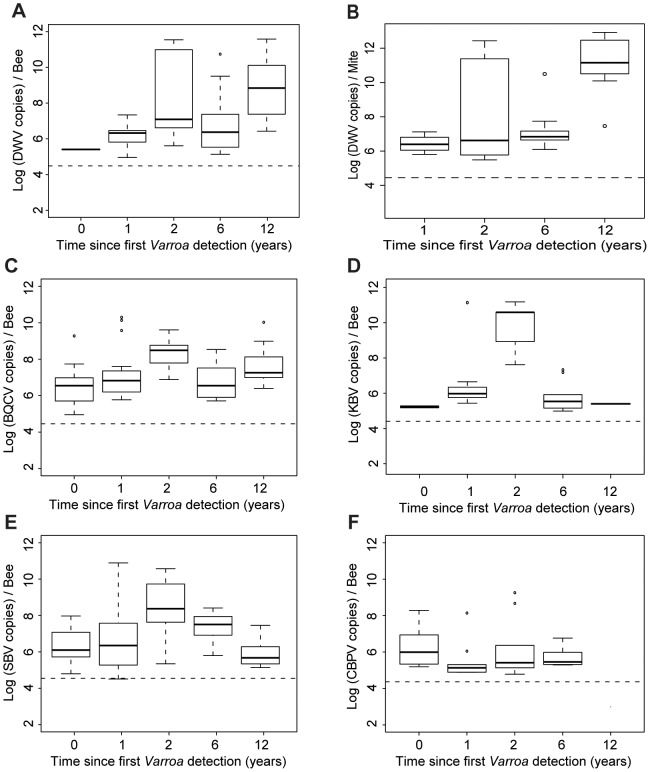
Over the past fifty years, annual honeybee (Apis mellifera) colony losses have been steadily increasing worldwide. These losses have occurred in parallel with the global spread of the honeybee parasite Varroa destructor. Indeed, Varroa mite infestations are considered to be a key explanatory factor for the widespread increase in annual honeybee colony mortality. The host-parasite relationship between honeybees and Varroa is complicated by the mite's close association with a range of honeybee viral pathogens. The 10-year history of the expanding front of Varroa infestation in New Zealand offered a rare opportunity to assess the dynamic quantitative and qualitative changes in honeybee viral landscapes in response to the arrival, spread and level of Varroa infestation. We studied the impact of de novo infestation of bee colonies by Varroa on the prevalence and titres of seven well-characterised honeybee viruses in both bees and mites, using a large-scale molecular ecology approach. We also examined the effect of the number of years since Varroa arrival on honeybee and mite viral titres. The dynamic shifts in the viral titres of black queen cell virus and Kashmir bee virus mirrored the patterns of change in Varroa infestation rates along the Varroa expansion front. The deformed wing virus (DWV) titres in bees continued to increase with Varroa infestation history, despite dropping infestation rates, which could be linked to increasing DWV titres in the mites. This suggests that the DWV titres in mites, perhaps boosted by virus replication, may be a major factor in maintaining the DWV epidemic after initial establishment. Both positive and negative associations were identified for several pairs of viruses, in response to the arrival of Varroa. These findings provide important new insights into the role of the parasitic mite Varroa destructor in influencing the viral landscape that affects honeybee colonies.


Conflict of interest statement

The authors have declared that no competing interests exist.

Figures

Figure 1
Figure 1. Map illustrating the spread of Varroa across New Zealand and the location of sampling sites.
Colours indicate the date Varroa was first confirmed in each area. Shaded tones from dark red to light yellow show the progression of the front of Varroa infestation. Control regions where the mite had not yet been detected are presented in white. Black dots indicate the location of the apiaries sampled in each region. The sampling transect crosses the front of infestation.
Figure 2
Figure 2. Quantitative analysis of the phoretic Varroa infestation.
(A) Varroa prevalence. The proportion of colonies where mites could be retrieved (black) versus not retrieved (white) is presented in terms of the sampling site location and number of years Varroa had been detected in the area. A significant increase in Varroa prevalence along the sampling transect is symbolised by the red curve (GLMM, Z = 4.14, p<0.001, 27≤n≤39). (B) Varroa infestation levels according to the number of years of confirmed exposure to Varroa. Number of phoretic mites per 100 bees (27≤n≤39). Stars indicate significant differences between years of infestation (Pairwise post-hoc comparisons, p<0.01).
Figure 3
Figure 3. Honeybee virus prevalence across the Varroa front of infestation.
Pathogen prevalence across the front of infestation, in bee samples and Varroa mite samples. The percentage of colonies assigned positive for each of the seven viruses monitored is compared between Varroa-free areas for bee samples (white bars, n = 39), Varroa-infested areas for bee samples (black bars, n = 75), and Varroa mite samples (grey bars, n = 34). Stars indicate significant differences between proportions (Chi-square, p<0.05). Viruses are presented in decreasing order of prevalence. The average pathogen prevalence in bee samples across all regions sampled is indicated on the x-axis below the pathogen acronym.
Figure 4
Figure 4. Principal component analyses of pathogen titres in honeybee and Varroa samples.
(A) Barplot of the eigenvectors of the PCA performed on the variables measured in bees. Variables included in the Principal Component Analysis (PCA) are the titres of 5 viruses (DWV, BQCV, CBPV, KBV, SBV) and the Varroa infestation rate (Var). Numbers above each bar indicate the cumulative percentage of variability explained by the successive eigenvectors. The two principal eigenvectors, represented by black bars, correspond to the axes used to plot the colonies in Figure 4.B. (B) Scatterplot of colonies analysed by PCA for the titres of 5 viruses plus the Varroa infestation rates in bees (n = 191). The colony values for the two principal components are plotted, with each colony represented by a filled circle. The colonies are clustered by colour and bound by an ellipse according to the number of years since the first detection of Varroa, indicated by the number located at the centre of gravity of each ellipse. The ellipse covers 67% of the samples belonging to the cluster. The colour code is the same as for Figure 1. (C) Barplot of the eigenvectors of the PCA performed on variables measured in bees and in Varroa. Variables included in the PCA are the titres of 4 virus species in bees (DWV, BQCV, KBV, SBV), titres of 4 virus species in Varroa (DWV.V, BQCV.V, KBV.V, SBV.V) and the Varroa infestation rates (Var). The numbers above each bar indicate the cumulative percentage of variability explained by the successive eigenvectors. The two principal eigenvectors, represented by the black bars, correspond to the axes used to plot the colonies in Figure 4.D. (D) Scatterplot of colonies analysed by PCA for virus titres in bees and mites plus the Varroa infestation rates (n = 83). The colony values for the two principal components are plotted, with each colony represented by a filled circle. The colonies are clustered by colour and bound by an ellipse, according to the number of years since the first detection of Varroa. Each ellipse covers 67% of the samples belonging to the cluster.
Figure 5
Figure 5. Virus titres in honeybees and Varroa mites along the Varroa front of expansion.
(A) DWV titres in bees (Log10 DWV copies/bee) according to the number of years of exposure to Varroa. A significant increase in the level of viral infestation was detected along the sampling transect (GLMM, t = 3.78, p<0.001, 30≤n≤41). (B) DWV titres in Varroa (Log10 DWV copies/mite) according to the number of years of confirmed exposure to Varroa. A significant increase in the level of viral infestation was detected along the sampling transect (GLMM, t = 4.55, p<10−5). (C) BQCV titres in bees (Log10 BQCV copies/bee) according to the number of years of exposure to Varroa. A significant increase in the level of viral infestation was detected along the sampling transect (GLMM, t = 3.35, p<0.001, 30≤n≤41). (D) KBV titres in bees (Log10 KBV copies/bee) according to the number of years of exposure to Varroa. (E) SBV titres in bees (Log10 SBV copies/bee) according to the number of years of exposure to Varroa. (F) CBPV titres in bees (Log10 CBPV copies/bee) according to the number of years of exposure to Varroa.

Similar articles

Cited by

References

    1. Loreau M, Naeem S, Inchausti P, Bengtsson J, Grime J, et al. (2001) Biodiversity and ecosystem functioning: current knowledge and future challenges. Science 294: 804–808. - PubMed
    1. Potts SG, Biesmeijer JC, Kremen C, Neumann P, Schweiger O, et al. (2010) Global pollinator declines: trends, impacts and drivers. Trends in Ecology & Evolution 25: 345–353. - PubMed
    1. UNEP (2010) Global honey bee colony disorders and other threats to insect pollinators; Issues UE, editor: UNEP Emerging Issues.
    1. Oldroyd BP (2007) What's killing American honey bees? PLoS biology 5: e168. - PMC - PubMed
    1. Alaux C, Brunet J-L, Dussaubat C, Mondet F, Tchamitchan S, et al. (2010) Interactions between Nosema microspores and a neonicotinoid weaken honeybees (Apis mellifera). Environmental Microbiology 12: 774–782. - PMC - PubMed

Publication types