. 2014 Aug 21;10(8):e1004513.
doi: 10.1371/journal.pgen.1004513. eCollection 2014 Aug.

LIN-3/EGF promotes the programmed cell death of specific cells in Caenorhabditis elegans by transcriptional activation of the pro-apoptotic gene egl-1

Affiliations

LIN-3/EGF promotes the programmed cell death of specific cells in Caenorhabditis elegans by transcriptional activation of the pro-apoptotic gene egl-1

Hang-Shiang Jiang et al. PLoS Genet. .

Abstract

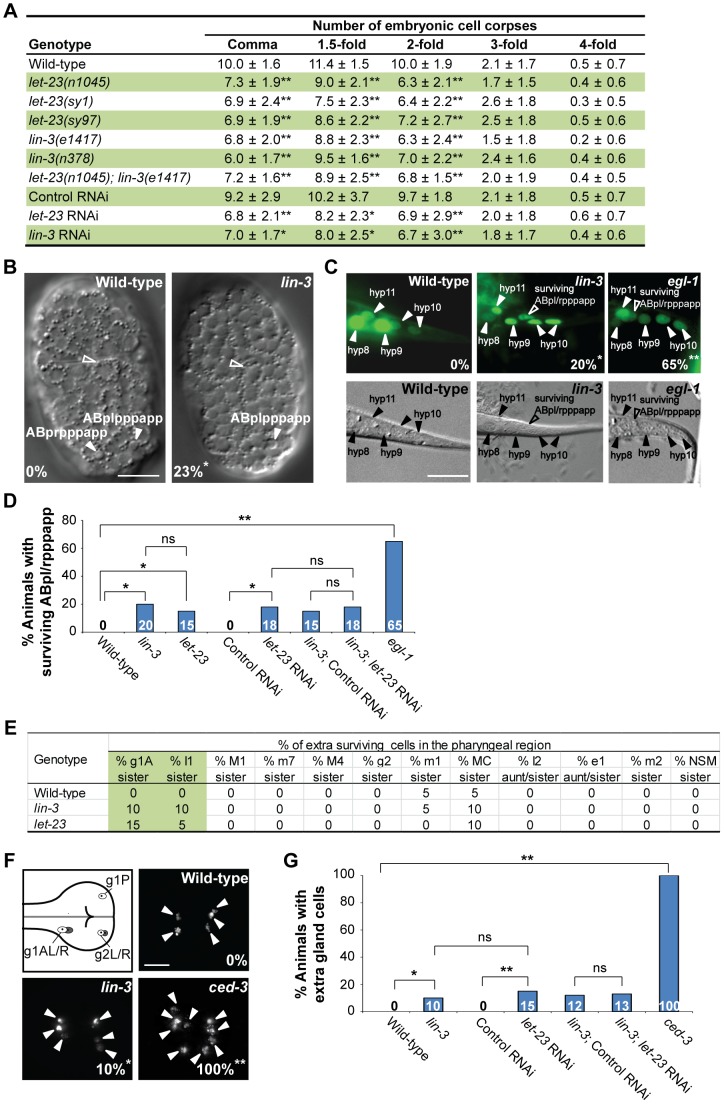
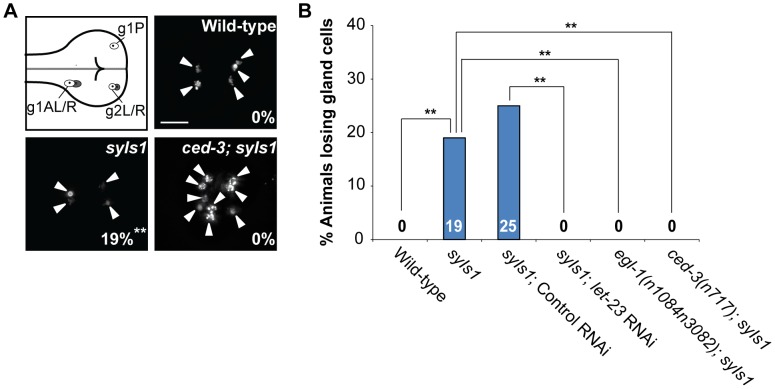
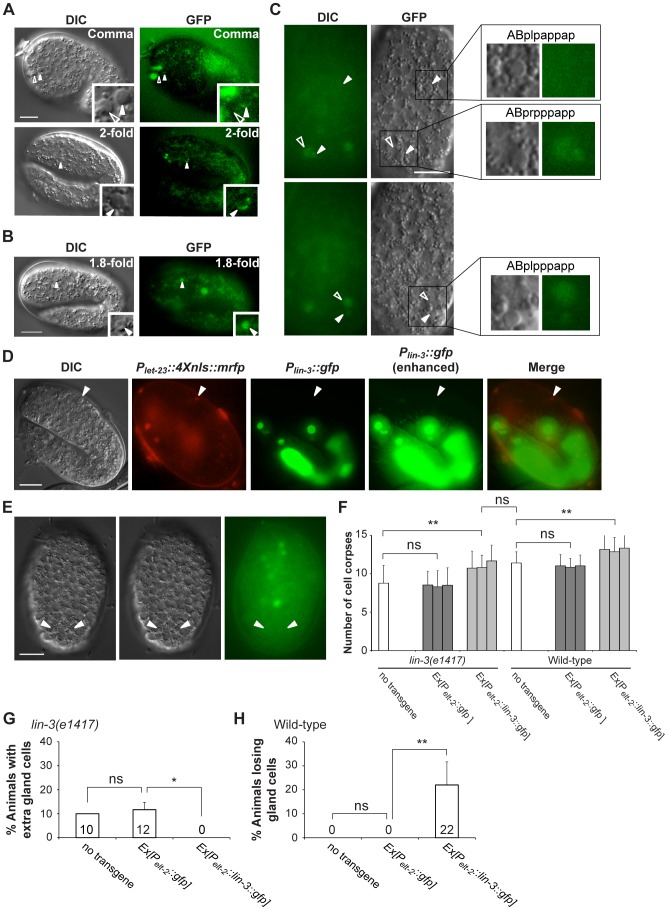
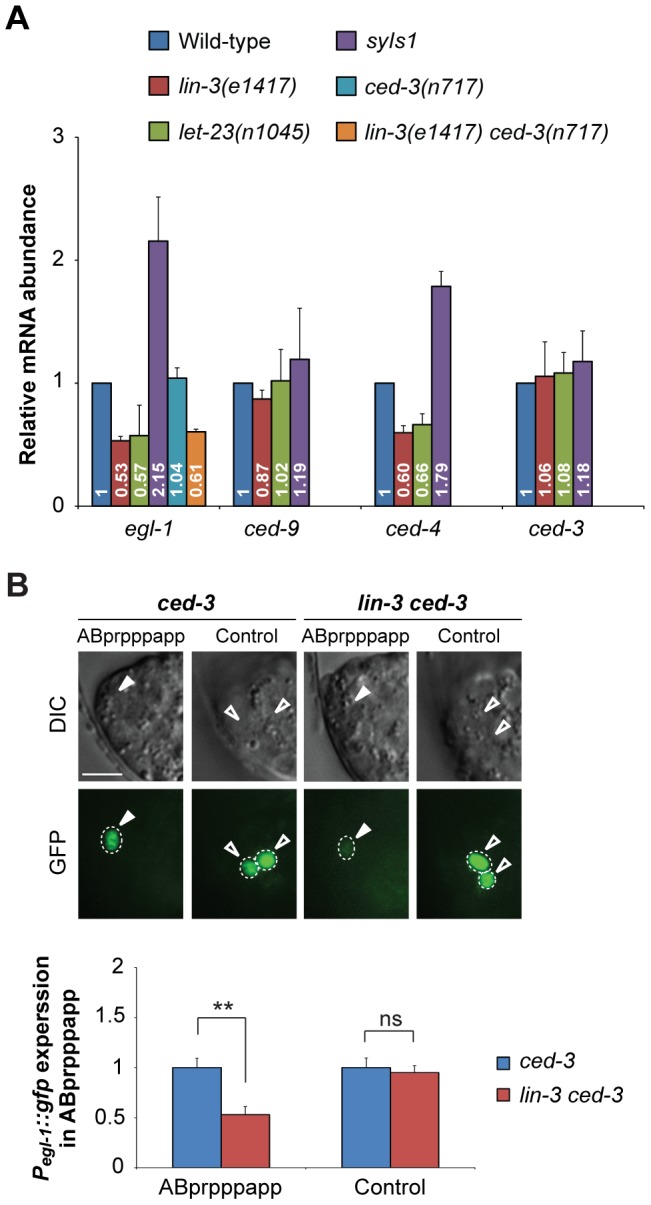
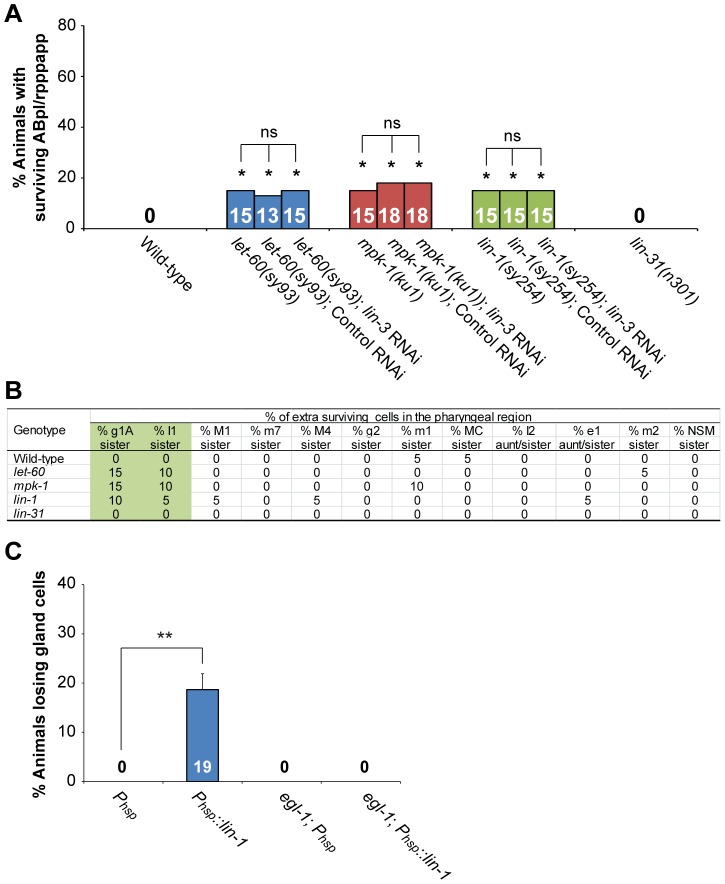
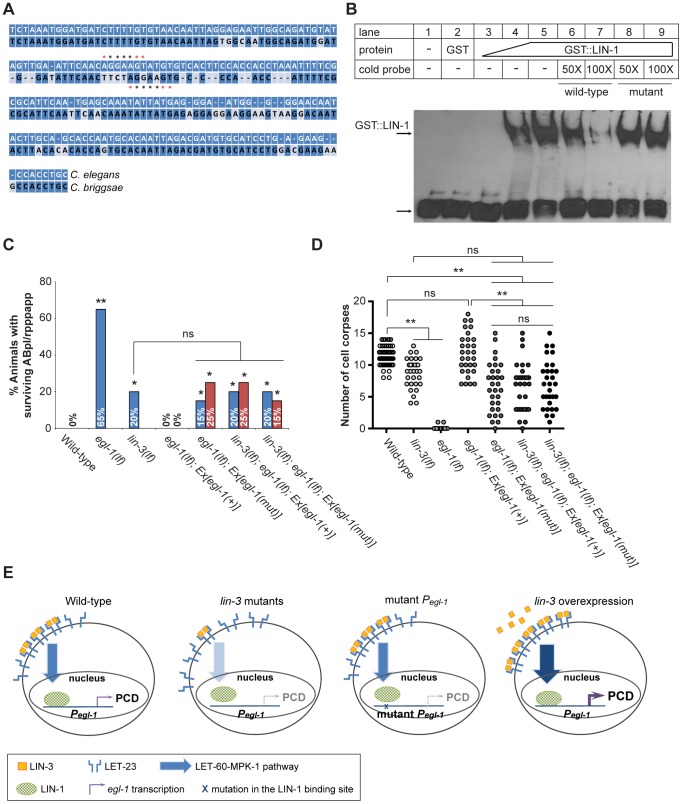
Programmed cell death (PCD) is the physiological death of a cell mediated by an intracellular suicide program. Although key components of the PCD execution pathway have been identified, how PCD is regulated during development is poorly understood. Here, we report that the epidermal growth factor (EGF)-like ligand LIN-3 acts as an extrinsic signal to promote the death of specific cells in Caenorhabditis elegans. The loss of LIN-3 or its receptor, LET-23, reduced the death of these cells, while excess LIN-3 or LET-23 signaling resulted in an increase in cell deaths. Our molecular and genetic data support the model that the LIN-3 signal is transduced through LET-23 to activate the LET-60/RAS-MPK-1/ERK MAPK pathway and the downstream ETS domain-containing transcription factor LIN-1. LIN-1 binds to, and activates transcription of, the key pro-apoptotic gene egl-1, which leads to the death of specific cells. Our results provide the first evidence that EGF induces PCD at the whole organism level and reveal the molecular basis for the death-promoting function of LIN-3/EGF. In addition, the level of LIN-3/EGF signaling is important for the precise fine-tuning of the life-versus-death fate. Our data and the previous cell culture studies that say EGF triggers apoptosis in some cell lines suggest that the EGF-mediated modulation of PCD is likely conserved in C. elegans and humans.


Conflict of interest statement

The authors have declared that no competing interests exist.

Figures

Figure 1
Figure 1. lin-3 and let-23 promote specific PCDs in C. elegans.
(A) The number of cell corpses was scored at indicated developmental stages and presented as the mean ± SD (n≥30). The rrf-3(pk1426) mutant was used to enhance the RNAi effect in RNAi experiments. Mutants were compared to wild-type, and RNAi treatment of individual genes was compared to control RNAi (*P<0.05 and **P<0.001, two-tailed t test). (B) The DIC images of the wild-type and lin-3(e1417) mutant embryos at approximately 270 min after fertilization. The white arrowheads indicate ABpl/rpppapp cell corpses and the hollow arrowheads indicate excretory cells. The percentage of embryos that did not have ABpl/rpppappcell corpse is shown in the bottom left corner. *P = 0.048 when compared to wild-type (Fisher's exact test). Twenty one and thirteen embryos were scored for wild-type and lin-3 mutants, respectively. Scale bar: 10 µm. (C) The GFP and DIC images of the wild-type, lin-3(e1417), and egl-1(n1084n3082) worms expressing sur-5::gfp at the L1 stage. The arrowheads indicate the nuclei of hyp8, hyp9, hyp10, and hyp11. The hyp10 cell is binuclear. The hollow arrowheads indicate a surviving ABpl/rpppapp. The percentage of worms with surviving ABpl/rpppapp is shown in the bottom right corner. *indicates P<0.05 and **P<0.001 when compared to wild-type (Fisher's exact test). More than thirty worms were scored for each genotype. Scale bar: 10 µm. The GFP protein expressed from the sur-5::gfp transgene is localized to almost all somatic nuclei . (D) The percentage of worms with surviving ABpl/rpppapp of the indicated genotypes was shown. *indicates P<0.05 and **P<0.001 (Fisher's exact test). ns indicates no statistical difference (p>0.05). Alleles used here are lin-3(e1417), let-23(sy1), and egl-1(n1084n3082). More than thirty worms were scored for each genotype. (E) Analysis of surviving cells in the pharyngeal region (n = 20). Alleles used here are lin-3(e1417) and let-23(n1045). (F) The g1 and g2 gland cells in the pharynx are shown in the illustration. The white circles indicate the five gland cells (g1P, g1AL, g1AR, g2L, and g2R) that normally survive and the gray circles the sister cells of g1AL, g1AR, g2L, and g2R that are destined to die. Monomeric red fluorescent protein (mRFP) images of the wild-type, lin-3(e1417), and ced-3(n717) worms expressing PB0280.7::4Xnls::mrfp are shown. The arrowheads indicate cells expressing mRFP. The percentage of animals that have extra gland cell(s) is shown in the bottom right corner. *indicates P<0.05 and **P<0.001 when compared to wild-type (Fisher's exact test). One hundred L4 animals were scored for each genotype. The image stacks were merged by maximum intensity projection using Image J. Scale bar: 10 µm. (G) The percentage of worms with extra gland cells of the indicated genotypes was shown. *indicates P<0.05 and **P<0.001 (Fisher's exact test). ns indicates no statistical difference (p>0.05). Alleles used here are lin-3(e1417) and ced-3(n717). More than forty worms were scored for each genotype.
Figure 2
Figure 2. Overexpression of lin-3 induces ectopic gland cell death(s) through let-23 and the core PCD pathway.
(A) Monomeric red fluorescent protein (mRFP) images of the wild-type, syIs1, and ced-3(n717); syIs1 worms expressing PB0280.7::4Xnls::mrfp are shown. The arrowheads indicate cells expressing mRFP. The percentage of animals losing gland cell(s) is shown in the bottom right corner. **indicates P<0.001 when compared to wild-type (Fisher's exact test). One hundred L4 animals were scored for each genotype. The image stacks were merged by maximum intensity projection using Image J. Scale bar: 10 µm. (B) The percentage of worms losing gland cell(s) of the indicated genotypes was shown. **indicates P<0.001 (Fisher's exact test). More than forty worms were scored for each genotype.
Figure 3
Figure 3. let-23 is expressed in dying cells, whereas lin-3 acts in a cell-nonautonomous manner to promote PCD.
(A and B) Representative DIC and GFP images of embryos carrying (A) the syEx234[Plet-23::let-23::gfp] transgene or (B) the Plet-23::4Xnls::gfp transgene. The white arrowheads indicate cell corpses expressing LET-23::GFP and the hollow arrowheads cell corpses not expressing LET-23::GFP. Scale bar: 10 µm. The insets show a dying cell at a three-fold higher magnification. (C) The DIC and GFP images of an embryo carrying the Plet-23::4Xnls::gfp transgene. Two different focal planes of the same embryo are shown in the upper and lower panels. The white arrowheads indicate ABpl/rpppapp corpses and ABplpappap and the hollow arrowheads sister cells of ABpl/rpppapp. Scale bar: 10 µm. The insets show the indicated cells at a higher magnification. (D) The expression pattern of Plin-3::gfp and Plet-23::4Xnls::mrfp transgenes in a wild-type embryo. The white arrowheads indicate the same cell corpse expressing Plet-23::4Xnls::mrfp. The image stacks of Plin-3::gfp were merged by maximum intensity projection using Image J. The strong GFP expression is from the co-injection marker Pelt-2::gfp. Scale bar: 10 µm. (E) Plin-3::gfp is not expressed in ABpl/rpppapp corpses. The image stacks of Plin-3::gfp were merged by maximum intensity projection using Image J. Scale bar: 10 µm. (F–H) Intestine-specific expression of LIN-3 rescues the cell death defect of the lin-3 mutant and causes ectopic cell deaths in the wild-type. Embryonic cell corpses in the indicated genotypes were scored at the 1.5-fold stage (n≥30), and the numbers of gland cells were scored at the L4 stage (n≥40). Three independent stable transgenic lines were analyzed. *indicates P<0.05 and **P<0.001 in a two-tailed t-test (F) or fisher's exact test (G and H). ns indicates no statistical difference (p>0.05).
Figure 4
Figure 4. lin-3 promotes egl-1 transcription.
(A) egl-1, ced-9, ced-4, and ced-3 transcripts in embryos of indicated genotypes were measured by quantitative RT-PCR. The relative mRNA abundance is shown as the mean and SD of the results from at least two independent experiments, each performed in triplicates. (B) The DIC and GFP images of ced-3 (left) and lin-3 ced-3 (right) embryos expressing the Pegl-1::gfp transgene. Arrowheads indicate ABprpppapp, and hollow arrowheads indicate two cells that also express egl-1 near ABprpppapp (Control experiment). The bottom figures show the Pegl-1::gfp expression level of the indicated cells in the ced-3 single mutant (blue) and the lin-3 ced-3 double mutant (red). The expression level of Pegl-1::gfp in ABprpppapp of ced-3(n717) (n = 44) and lin-3(e1417) ced-3(n717) (n = 40) mutants was analyzed as described in Materials and Methods. Error bars represent the SEM. **indicates P<0.001 (two-tailed t test). Scale bar: 5 µm.
Figure 5
Figure 5. lin-3, lin-1 and the LET-60-MPK-1 pathway act in the same pathway to promote PCD.
(A) The percentage of worms with surviving ABpl/rpppapp of the indicated genotypes was shown. *indicates P<0.05 when compared to the wild-type (Fisher's exact test). ns indicates no statistical difference (p>0.05). More than thirty worms were scored for each genotype. (B) Analysis of extra surviving cells in the pharyngeal region (n = 20). Alleles used here are let-60(sy93), mpk-1(ku1), lin-1(sy254), and lin-31(n301). (C) The percentage of wild-type or egl-1(n1084n3082) worms carrying the indicated transgene that lost gland cell(s) in the pharynx was shown. **P<0.001 (Fisher's exact test). The gland cells were scored using the tpIs8 transgene, and the worms were treated with heat shock as described in Materials and Methods. Phsp::lin-1 or Phsp indicate the transgenes, in which lin-1 or no cDNA was expressed under the control of the heat-shock promoter, respectively. More than forty worms were scored for each genotype.
Figure 6
Figure 6. lin-3 promotes PCD through transcriptional activation of egl-1 by LIN-1.
(A) The alignment between the C. elegans and C. briggsae genomic sequences near the P3 fragment. *indicates the LIN-1 minimal recognition sequence GGAA/T. (B) GST::LIN-1(DBD) directly binds to the egl-1 promoter in an EMSA assay. Lane 1, no protein; lane 2, 200 ng of GST; lanes 3–5, 10, 50, or 200 ng of GST::LIN-1(DBD); lane 6: 200 ng of GST::LIN-1(DBD)+50× wild-type cold probe; lane 7, 200 ng of GST::LIN-1(DBD)+100× wild-type cold probe; lane 8, 200 ng of GST::LIN-1(DBD)+50× mutant cold probe; lane 9, 200 ng of GST::LIN-1(DBD)+100× mutant cold probe. The bottom arrow indicates non bound probe and the top arrow DNA bound to GST::LIN-1(DBD) and displaying retarded mobility. (C) The percentage of animals with surviving ABpl/rpppapp of the indicated genotypes was scored (n≥30). Ex[egl-1(+)] and Ex[egl-1(mut)] indicate wild-type and mutant egl-1 transgenes, respectively, as described in the text. The surviving ABpl/rpppapp was scored using the sur-5::gfp reporter as described in Figure 1B. Two independent stably transmitted lines were analyzed for each transgene. Alleles used: lin-3(e1417) and egl-1(n1084n3082). *indicates P<0.05 and **P<0.001 when egl-1(lf) and lin-3(lf) were compared to wild-type or the transgenic strains were compared to egl-1(lf); Ex[egl-1(+)] (Fisher's exact test). ns, no significance. (D) Cell corpses in the embryos of the indicated genotypes carrying the wild-type or mutant egl-1 gene were scored at the 1.5-fold stage (n≥30). Each circle represents a single embryo. At least three independent stably transmitted lines were analyzed for each transgene. Alleles used: lin-3(e1417) and egl-1(n1084n3082). **indicates P<0.001 in a two-tailed t-test. ns indicates no statistical difference (p>0.05). (E) Proposed model of how lin-3 promotes PCD (see text for details).

Similar articles

Cited by

References

    1. Fuchs Y, Steller H (2011) Programmed cell death in animal development and disease. Cell 147: 742–758. - PMC - PubMed
    1. Baehrecke EH (2002) How death shapes life during development. Nat Rev Mol Cell Biol 3: 779–787. - PubMed
    1. Lettre G, Hengartner MO (2006) Developmental apoptosis in C. elegans: a complex CEDnario. Nat Rev Mol Cell Biol 7: 97–108. - PubMed
    1. Potts MB, Cameron S (2011) Cell lineage and cell death: Caenorhabditis elegans and cancer research. Nat Rev Cancer 11: 50–58. - PubMed
    1. Sulston JE, Horvitz HR (1977) Post-embryonic cell lineages of the nematode, Caenorhabditis elegans . Dev Biol 56: 110–156. - PubMed

Publication types

MeSH terms

LinkOut - more resources