. 2014 Aug 21;10(8):e1004309.
doi: 10.1371/journal.ppat.1004309. eCollection 2014 Aug.

Assembly and architecture of the EBV B cell entry triggering complex

Affiliations

Assembly and architecture of the EBV B cell entry triggering complex

Karthik Sathiyamoorthy et al. PLoS Pathog. .

Abstract

Epstein-Barr Virus (EBV) is an enveloped double-stranded DNA virus of the gammaherpesvirinae sub-family that predominantly infects humans through epithelial cells and B cells. Three EBV glycoproteins, gH, gL and gp42, form a complex that targets EBV infection of B cells. Human leukocyte antigen (HLA) class II molecules expressed on B cells serve as the receptor for gp42, triggering membrane fusion and virus entry. The mechanistic role of gHgL in herpesvirus entry has been largely unresolved, but it is thought to regulate the activation of the virally-encoded gB protein, which acts as the primary fusogen. Here we study the assembly and function of the reconstituted B cell entry complex comprised of gHgL, gp42 and HLA class II. The structure from negative-stain electron microscopy provides a detailed snapshot of an intermediate state in EBV entry and highlights the potential for the triggering complex to bring the two membrane bilayers into proximity. Furthermore, gHgL interacts with a previously identified, functionally important hydrophobic pocket on gp42, defining the overall architecture of the complex and playing a critical role in membrane fusion activation. We propose a macroscopic model of the initiating events in EBV B cell fusion centered on the formation of the triggering complex in the context of both viral and host membranes. This model suggests how the triggering complex may bridge the two membrane bilayers, orienting critical regions of the N- and C- terminal ends of gHgL to promote the activation of gB and efficient membrane fusion.


Conflict of interest statement

The authors have declared that no competing interests exist.

Figures

Figure 1
Figure 1. Biochemical assembly of the EBV B cell triggering complex.
(A) In-vitro assembly of the EBV gHgL/gp42/HLA-DQ2 triggering complex (red, indicated by arrow) using size exclusion chromatography (S200). The triggering complex elutes at 10.7 ml (Ve, elution volume) with an estimated apparent MW of 255 kDa (also see Table 1). This complex is formed from EBV gHgL/gp42 complex (brown) mixed with excess HLA-DQ2 (green). Excess HLA-DQ2 can be seen as a second individual peak in the red trace. EBV gHgL/gp42 complex (brown) is formed quantitatively from 1∶1 molar mixture of gHgL (blue) and gp42 (purple). (B) Thermodynamic cycle linking the two pathways to the formation of the triggering complex. The horizontal (top and bottom) reactions represent the binding of HLA to either free gp42 or to gHgL/gp42 complexes, respectively. Similarly, the vertical (left and right) reactions represent the binding of gHgL to either gp42 or gp42/HLA complexes.
Figure 2
Figure 2. BioLayer interferometry (BLI) binding studies with wildtype gp42.
Binding kinetics were measured with the Octet RED96 instrument (ForteBio, Pall Corporation) using wildtype (wt) gp42 protein. (A) Biotinylated EBV gHgL was immobilized on streptavidin (SA) biosensor tips and incubated over a range of concentrations (0.4–100 nM) of soluble wt gp42. (B) Biotinylated HLA-DQ2 (CLIP1) was immobilized on streptavidin biosensor tips and incubated over a range of concentrations (2–1200 nM) of soluble wt gp42. (C) Immobilized HLA-DQ2 (CLIP1) was incubated with increasing concentrations of preformed gHgL/gp42 complexes (30–800 nM). Data was fit globally to different binding schemes corresponding to a 1∶1 langmuir binding isotherm (A) and a 2∶1 heterogeneous ligand binding model (B and C). (D) Steady state analysis of the gHgL/gp42 binding to HLA-DQ2 shown in C for equilibrium KD determination. Fitted kinetic and equilibrium binding constants are collected in Table 2.
Figure 3
Figure 3. Negative-stain electron microscopic (EM) image classificaion of the EBV gHgL/gp42/HLA-DQ2 triggering complex.
(A) A representative negative-stain EM image of gHgL/gp42/HLA-DQ2 sample. (B) Representative class averages of gHgL/gp42. Shown to the side is a schematic representation depicting the variability in the gp42 CTLD position along the length of gHgL before HLA-class II binding. (C) Representative class averages of gHgL/gp42/HLA-DQ2 complexes in open and closed conformations in ∼50∶50 proportion. The particle numbers included in the ternary complex classes are also indicated in each class average in (C).
Figure 4
Figure 4. RCT 3D reconstructions of the EBV gHgL complexes.
EM structure of the intact triggering complex in the closed (A) and a representative open (B) conformation fit with the known crystal structures of gHgL, gp42 and HLA class II. A unique solution to the fitting was obtained either with EBV gHgL (3PHF) and gp42/HLA-DR1 complex (1KG0) (depicted here), or EBV gHgL (3PHF) and gp42 (3FD4) and HLA-DQ2 (1S9V). EBV gH and gL are shown in blue and cyan, respectively. EBV gp42 represented in hotpink, and HLA-DR1 shown in green (α-chain) and orange (β-chain). (C) EM reconstruction and fitting of the component crystal structures of a representative conformational state of the gHgL/gp42 complex. (D) Fourier shell correlations (FSC) of the RCT 3D reconstructions from 1,219, 604, and 657 65°-tilted particle images for the closed complex (black), the open complex (red), and the gHgL/gp42 subcomplex (blue), respectively. The resolution of the 3D reconstruction is estimated at FSC = 0.5.
Figure 5
Figure 5. The pseudoatomic model of the triggering complex places the gp42 HP in contact with gH.
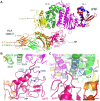
(A) Pseudo-atomic model of the gHgL/gp42/HLA-DQ2 complex obtained from the EM envelope fitting. The individual domains of each protein are marked and the hydrophobic pocket (HP) in gp42 is highlighted with an arrow. The C-termini of gH and HLA chains are similarly marked and lie on one side of the complex at ∼70 Å of each other. (B) The gp42 HP interaction site with gHgL. Two sides of the gp42 HP interact with gH between D-II and D-III, including a loop between helices 2α-6 and 2α-7 from D-II and helix 3α-9 from D-III. Residues that have been previously mutated in the gp42 HP are indicated, H206 and T193 that had linker insertions as Cα spheres (dark blue) and F210 as sticks (dark blue) within the hydrophobic pocket (light blue Cα spheres) as defined in , , which disrupt membrane fusion activity. I159 is also shown as sticks (light blue). The gp42 HP faces away from the observer in this orientation. The gp42 interaction with the HLA-class II β-chain (orange) brings gH and HLA into close proximity. Residue C114 which is the only unpaired cysteine in wt gp42 is shown as sticks (light blue) (C) Close-up view of gp42 residue I159 (blue), located in the gp42 158 loop , at the junction of the HLA and gH contact sites. The locations of gH mutant residues that were tested are indicated, including G276 (cyan) in the 2α-6/2α-7 loop (D-II) and D511 and S507 in the 3α- helix 9 (D-III). The view is rotated 180° along vertical axis and then rotated 45° counter-clockwise with the horizontal axis compared to the orientation shown in (A) and (B). Images were rendered using MacPyMol .
Figure 6
Figure 6. Modifications of gp42 residue I159 disrupt membrane fusion with B cells.
In panels (A) and (B), CHO cells were transfected with gB, gHgL, and a T7-Luciferase reporter and either 0.1 µg or 1.0 µg soluble purified gp42 or gp42 mutant was added 24 hours post transfection along with T7 expressing Daudi B cells. The negative control (F12 media) was similarly transfected and mixed with Daudi cells but no soluble gp42 protein was added. (A) The wildtype gp42 residue C114 is not important for membrane fusion activity. Treatment of wt gp42 with reducing (TCEP) and alkylating (IAA) agents, to irreversibly block the C114 –SH group, does not affect gp42 membrane fusion activity. Mutation of C114 to serine also does not affect membrane fusion activity, it also has no unpaired cysteines due to the mutation and hence is not treated with reducing agent or alkylating agent. (B) Mutation and chemical modifications of gp42 residue 159 block membrane fusion activity. Fusion assay results of wt gp42, I159C (reduced with TCEP), I159C (reduced and alkylated with IAA) and I159C site-specifically pegylated with maleimidePEG 2000 and 10000 MWavg (denoted as mPEG2K and mPEG10K). (C) Gel filtration traces of gp42 I159C along with gp42 I159C modified with mPEG2K or mPEG10K. The shift in elution volume (Ve) with increasing molecular weights of PEGylation is evident, allowing purification of the appropriately modified gp42 protein for fusion assays and complex formation with gHgL and HLA for EM imaging. The peaks for the purified fraction of the gp42 mutant protein are denoted as I159C-Untreated, I159C-mPEG2K and I159C-mPEG10K from right to left respectively. Abbreviations: TCEP is Tris(2-carboxyethyl)phosphine, hydrochloride; IAA is Iodoacetamide and, mPEG stands for maleimide-polyethylene glycol and mPEG2K or mPEG10K denotes this chemical with a MWavg 2000 or 10,000 Da.
Figure 7
Figure 7. Mutation of gp42 I159 does not affect binding affinity or kinetics with gHgL or HLA-DQ2.
Kinetic binding experiments were conducted similarly to Figure 2 on the OctetRED96. For panels A and B site-specifically biotinylated HLA-DQ2 (CLIP1) was immobilized on the streptavidin (SA) biosensor tip surfaces. Binding kinetics of HLA-DQ2 (ligand) with the single mutant gp42 C114S (A) or the gp42 I159C double mutant (B) are depicted. Global curve fitting with a 2∶1 heterogeneous ligand model closely matched the experimental data. The calculated binding curves are shown overlaid on the data from the experiment. For panels C and D, biotinylated EBV gHgL was immobilized on the streptavidin (SA) biosensor surfaces. Binding kinetics of EBV gHgL with the single mutant gp42 C114S (C) or I159C double mutant (D) are depicted. Overlay curves show the global fitting results using a 1∶1 Langmuir binding model. Kinetic and thermodynamic binding constants are similar to binding gp42 wildtype (Figure 2 and Table 2). (E) Representative class averages of gHgL/gp42-PEG2K/HLA-DQ2 complexes. The gp42 I159C mutant was labeled with PEG-2K maleimide and used to form complexes with gHgL and HLA-DQ2, which were by purified gel filtration chromatography. Representative angles between the two arms of the complexes formed by gHgL and gp42/HLA are indicated as well as the number of particles included in each class.
Figure 8
Figure 8. Mutations in gH at the interface with the gp42 HP affect membrane fusion.
Cell surface expression and fusion assay results with B cells with gH mutants in the R488, S507 and D511 regions. Cell surface expression was measured using the anti-gHgL monoclonal antibody E1D1. (A) The gH D-II and D-III sequence observed proximal to the gp42 HP from our EM model has been highlighted to show the sequence and secondary structure indicating the mutual positions of the mutations in gH that would validate the EM model. The residue mutated to Asn (N) that gets potentially glycosylated is shown in bold text, the NX[S/T] motif is underlined. Cystine bridge between C278–C335 is highlighted; EBV gH D-II and D-III mutants to validate the position of residues in gH close to HP as revealed in our EM model are studied in the following panels (B) and (C); (B) gH G276N in the background of the disulfide bond mutant C278A/C335A does not have the glycosylation motif NX[S/T] and exhibits near wildtype fusion levels with B cells. By contrast, the G276N/C278S that introduces the glycosylation motif at 276 reduces fusion levels to lower than 40%. (C) The R488A mutation does not have a significant effect on gHgL expression or B cell fusion, while the R488N/K90T mutation reduces expression and membrane fusion. The D511N/F513S mutant and its control (F513S) show drastically reduced surface expression and B cell fusion. Both gH507N/A509S and the control gH A509S are expressed near wildtype levels and the gH S507N glycosylation mutant shows a reduction in membrane fusion activity. The mutants where the surface expression is as good as the gp42 wildtype but the fusion levels are down (below ∼40% or less) are highlighted in the rounded rectangular box. Mutants that result in potential glycosylation due to the introduced residue change are shown with a check mark.
Figure 9
Figure 9. EBV B cell fusion model based on the gHgL/gp42/HLA (“triggering complex”) structure.
(A) Model of the EBV B cell triggering complex in the context of viral and cellular lipid bilayers, with gHgL (blue/cyan), gp42 (hot pink) and HLA class II (green/orange). Locations of the transmembrane (TM) domains of gH and HLA- are indicated schematically with rectangles spanning the viral and cellular bilayers on one side of the complex and a separation of ∼70 Å. The C-termini of gH and HLA class II are also indicated. Although gp42 is a type II transmembrane protein, the N-terminal TM domain must be cleaved for it to be active in fusion and the resulting location in the triggering complex of the gp42 mature N-terminus is not known. The ∼170 Å long complex suggests a skewed orientation of the proteins relative to the two bilayers that could bridge viral-cellular membranes, potentially distorting and/or otherwise preparing the site for subsequent membrane fusion. This model places gL residues (Q54 and K94) involved in gB activation on the opposite side of the gH and HLA membrane anchors. The external location of gB implied by this model may indicate an initial peripheral activation of gB followed by its movement to a more central position to mediate membrane fusion. The gp42 HP, which is critical for fusion activation and located at the gH D-II/D-III junction, is highlighted to show its location with respect to the triggering complex. A potential postfusion arrangement of the triggering complex is show in the inset to the lower right. (B) Schematics of the V/Y shape of the open and closed triggering complexes highlighting their similarity to the structures observed in cryo-ET studies of HSV-1 entry described in .

References

    1. Rickinson A, Kieff E (2007) Epstein-Barr Virus. In: Fields Virology Knipe D, Fields B, editors. Volume 2. Philadelphia: Lippincott, Williams and Wilkins. pp. 2655–2700.
    1. Harrison SC (2008) Viral membrane fusion. Nat Struct Mol Biol 15: 690–698. - PMC - PubMed
    1. Hutt-Fletcher LM (2007) Epstein-Barr virus entry. J Virol 81: 7825–7832. - PMC - PubMed
    1. Connolly SA, Jackson JO, Jardetzky TS, Longnecker R (2011) Fusing structure and function: a structural view of the herpesvirus entry machinery. Nat Rev Microbiol 9: 369–381. - PMC - PubMed
    1. Eisenberg RJ, Atanasiu D, Cairns TM, Gallagher JR, Krummenacher C, et al. (2012) Herpes virus fusion and entry: a story with many characters. Viruses 4: 800–832. - PMC - PubMed

Publication types

MeSH terms