. 2014 Aug 21:3:e03528.
doi: 10.7554/eLife.03528.

Extensive translation of small Open Reading Frames revealed by Poly-Ribo-Seq

Affiliations

Extensive translation of small Open Reading Frames revealed by Poly-Ribo-Seq

Julie L Aspden et al. Elife. .

Abstract

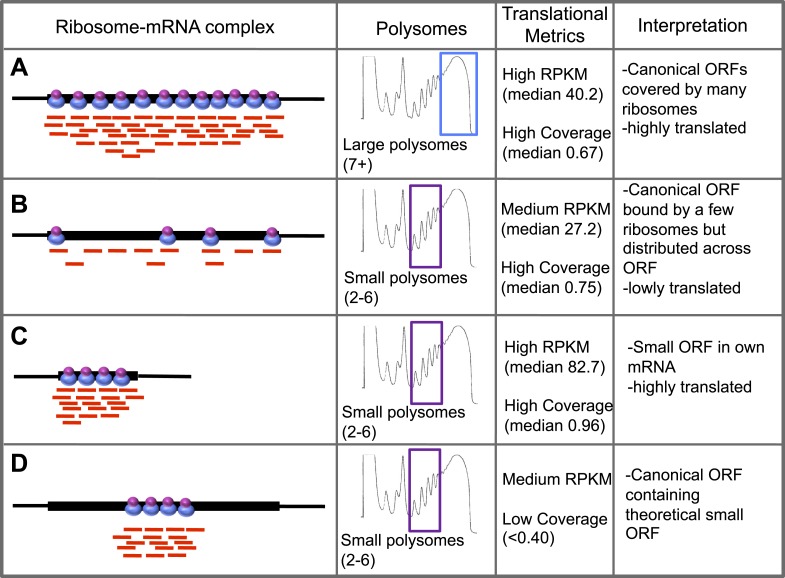
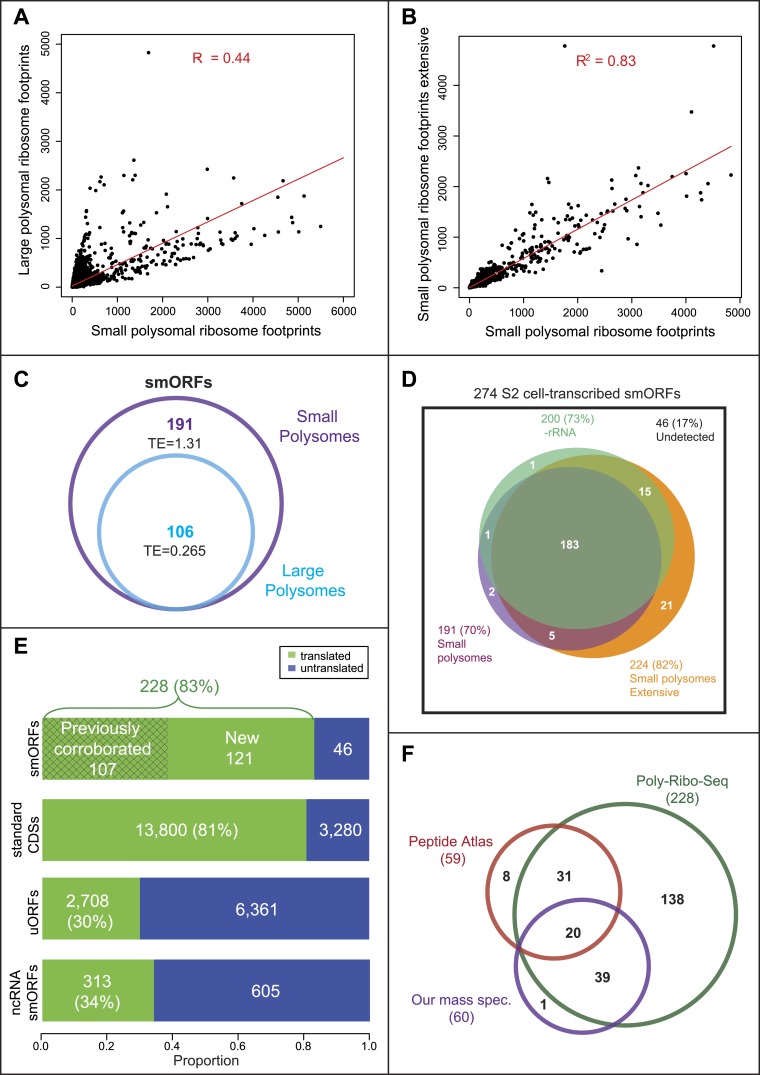
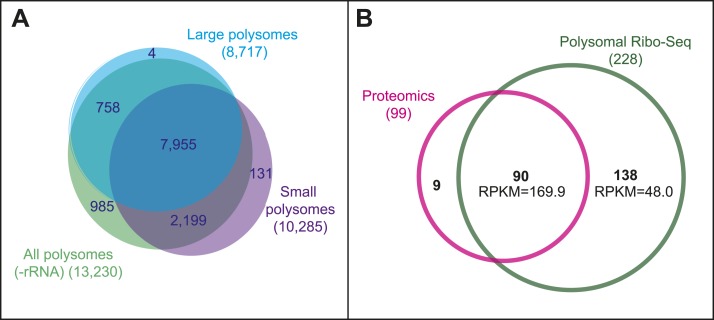
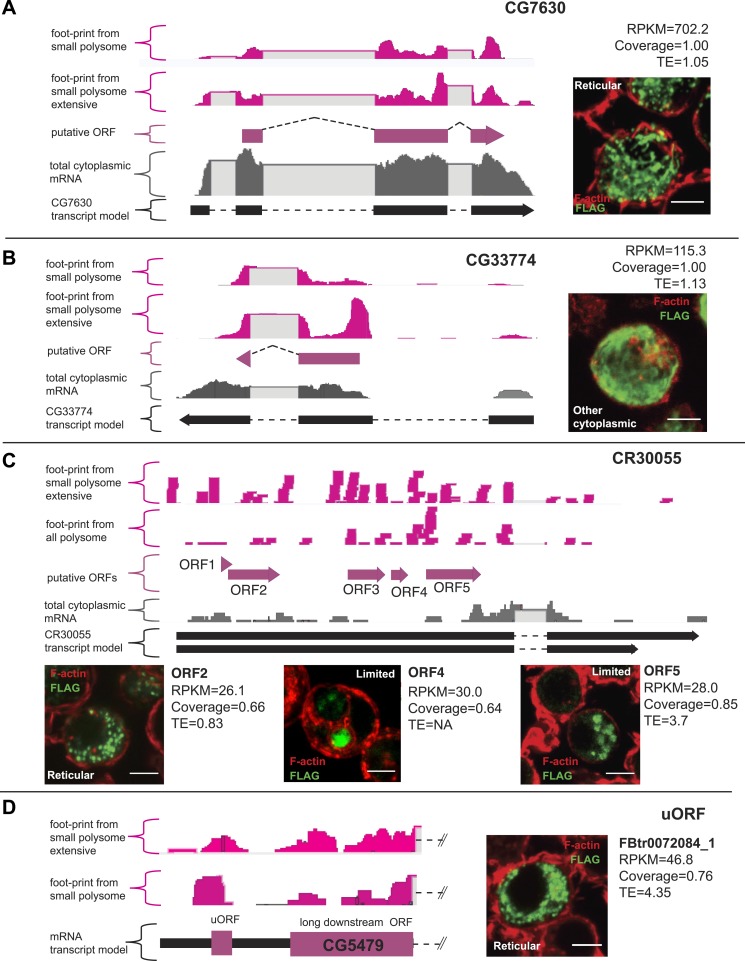
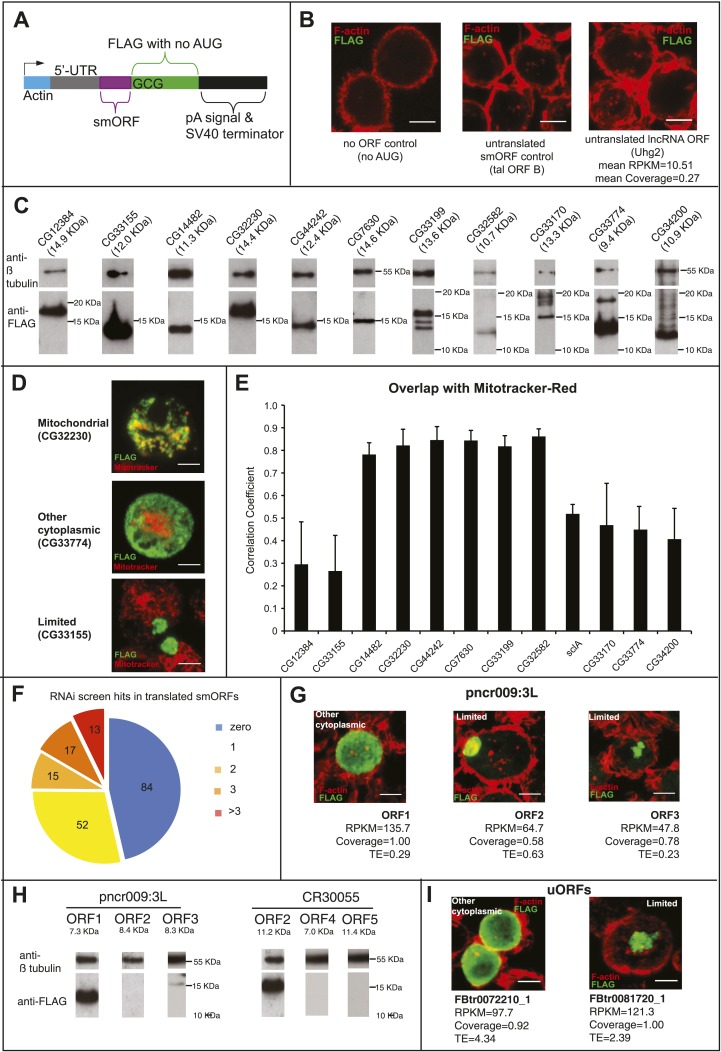
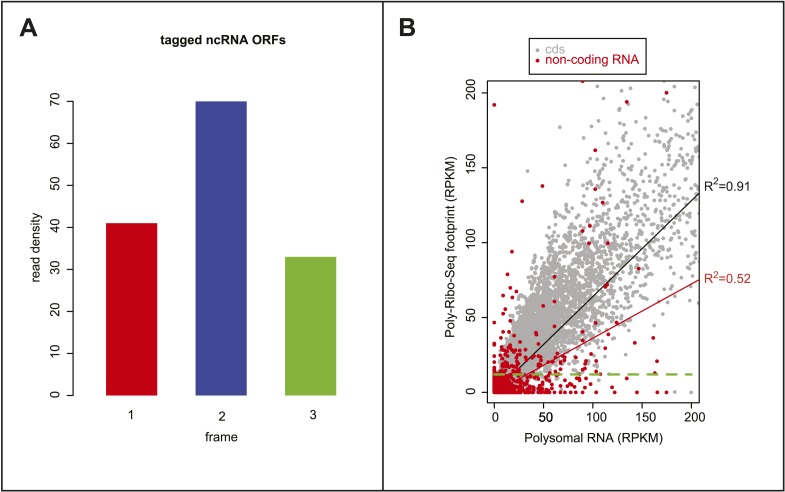
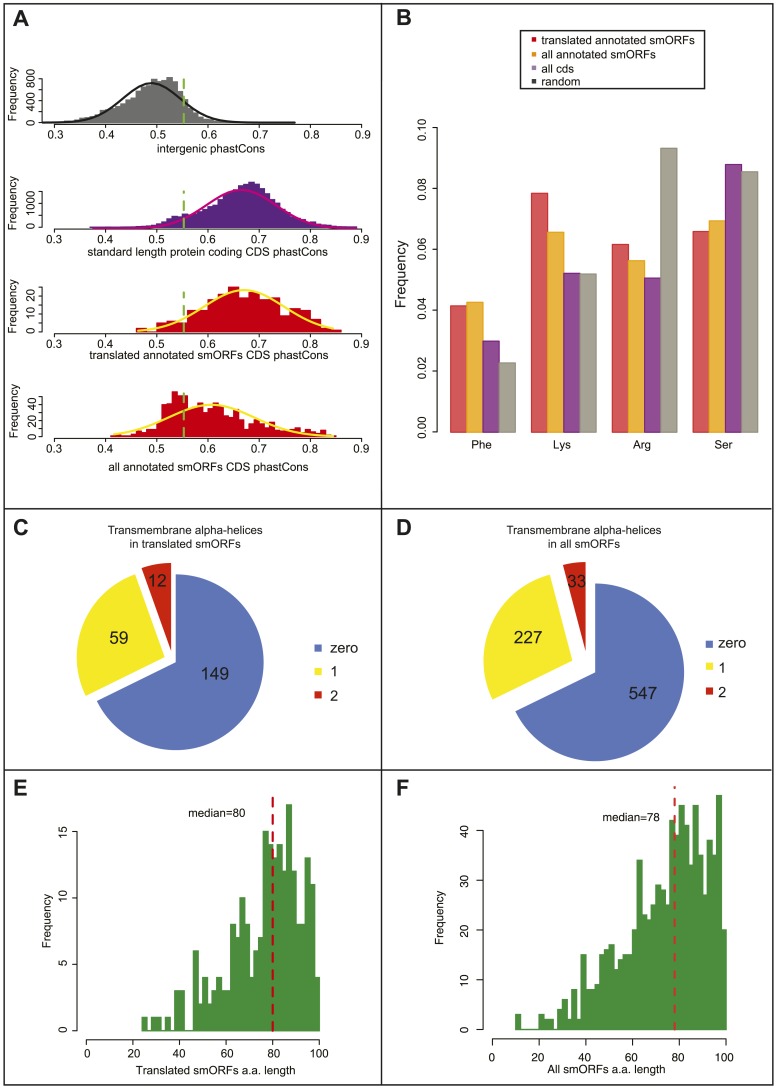
Thousands of small Open Reading Frames (smORFs) with the potential to encode small peptides of fewer than 100 amino acids exist in our genomes. However, the number of smORFs actually translated, and their molecular and functional roles are still unclear. In this study, we present a genome-wide assessment of smORF translation by ribosomal profiling of polysomal fractions in Drosophila. We detect two types of smORFs bound by multiple ribosomes and thus undergoing productive translation. The 'longer' smORFs of around 80 amino acids resemble canonical proteins in translational metrics and conservation, and display a propensity to contain transmembrane motifs. The 'dwarf' smORFs are in general shorter (around 20 amino-acid long), are mostly found in 5'-UTRs and non-coding RNAs, are less well conserved, and have no bioinformatic indicators of peptide function. Our findings indicate that thousands of smORFs are translated in metazoan genomes, reinforcing the idea that smORFs are an abundant and fundamental genome component.

Keywords: biochemistry; d. melanogaster; evolutionary biology; genomics; non-coding RNAs; small open reading Frames; transmembrane peptides.


Conflict of interest statement

The authors declare that no competing interests exist.

Figures

Figure 1.
Figure 1.. Poly-Ribo-Seq of small and large polysomes.
(A) Venn diagram categorising annotated Drosophila smORFs as corroborated or uncorroborated based on evidence (FlyBase) from two out of three of: GO molecular function term assignment (green), peptidomic evidence (blue), and conservation outside of insects (red). Based on this, out of the total of 829 annotated smORFs, 665 are uncorroborated, and 494 have no evidence of translation. (B) Schematic of Poly-Ribo-Seq with representative UV absorbance profile for sucrose density gradient. Small (purple) and large (blue) polysomes are separated and subject to ribosome footprinting. (C) Composite plot from all FlyBase protein-coding genes of Poly-Ribo-Seq read counts across mRNAs in the vicinity of start (upper) and stop codons (lower) in small polysomes. (D) Median translational efficiencies of CDS, 5′ and 3′-UTR regions for all protein-coding genes, error bars represent SE. DOI: http://dx.doi.org/10.7554/eLife.03528.004
Figure 1—figure supplement 1.
Figure 1—figure supplement 1.. Poly-Ribo-Seq of small and large polysomes.
(A) RT-PCR of RNA recovered from sucrose gradient fractions for one standard ORF mRNA (heph), three annotated smORF mRNAs (CG14818, CG9032, and CG43194) and one long non-coding RNA (roX1), with -RT control. Fractions corresponding to small (purple, 2-6 ribosomes) and large (blue, 7 or more ribosomes) polysomes are indicated. (B) Read densities (RPKM) from two biological replicates of the total cytoplasmic mRNA control exhibit very high correlation (R2 = 0.96). (C and D) Read density plots showing phasing of ribosome footprinting reads in triplets corresponding to codons in CDS (C) and an absence of triplet phasing in 3′-UTRs (D) (small polysome data). DOI: http://dx.doi.org/10.7554/eLife.03528.005
Figure 1—figure supplement 2.
Figure 1—figure supplement 2.. Schematic interpretation of Poly-Ribo-Seq.
Schematic summary of characterised (AC) and theoretical (D) translation scenarios. Diagrams of ribosome–mRNA complexes are shown along with the polysome fraction in which it is detected, translational metrics and interpretation of this information, for (AC) long canonical ORFs, (C) smORFs, and (D) canonical ORF containing a theoretical small ORF. DOI: http://dx.doi.org/10.7554/eLife.03528.006
Figure 2.
Figure 2.. Poly-Ribo-Seq reveals translation of smORFs.
(A) Ribosome footprinting densities (RPKM) from small polysomes correlate poorly with large polysomes (whereas two replicates of total cytoplasmic mRNA controls do, see Figure 1—figure supplement 1B). (B) Ribosome footprinting densities (RPKM) from small polysomes correlate highly between two biological replicates (R2 = 0.83). (C) All 106 smORFs detected in large polysomes (blue) were also present in the 191 detected in small polysomes (purple). smORF footprints are much more abundant in small polysomes, as indicated by a higher TE value. (D) High coincidence of annotated smORFs detected as translated in three different Poly-Ribo-Seq experiments. Small polysome extensive experiment probes most deeply with 224 smORFs detected as translated (small polysomes: purple, small polysomes extensive: yellow, -rRNA: turquoise). (E) Numbers and proportions of transcribed ORFs, which are translated, according to Poly-Ribo-Seq data (translated: green, untranslated: blue). The proportion of annotated smORFs translated is similar to that of standard CDSs. 121 annotated smORFs are newly detected as translated, plus 2708 uORFs and 313 smORFs from ncRNAs. (F) Venn diagram showing overlap between Poly-Ribo-Seq (dark green), our mass spectrometry experiments (purple) and Peptide Atlas proteomic data (red). DOI: http://dx.doi.org/10.7554/eLife.03528.007
Figure 2—figure supplement 1.
Figure 2—figure supplement 1.. Poly-Ribo-Seq reveals translation of smORFs.
(A) Results of Poly-Ribo-Seq experiments with all (-rRNA: turquoise), large (blue), and small (purple) polysomes showing the number of canonical protein-coding ORFs (longer than 100 aa) translated and the overlap between experiments. (B) Venn diagram showing the overlap in the detection of translation between Poly-Ribo-Seq (dark green) and proteomic experiments (pink). Median RPKMs from Poly-Ribo-Seq are indicated. DOI: http://dx.doi.org/10.7554/eLife.03528.008
Figure 3.
Figure 3.. Validation of smORF translation by tagging assay.
(AD) Ribosome footprints from small polysomes (pink) and mRNA reads (grey) mapped to smORFs, along with transcript and ORF models of (A) CG7630, (B) CG33774, (C) CR30055 (ncRNA), and (D) FBtr0072084_1 (uORF). Corresponding transfection assays in S2 cells are shown (FLAG antibody: green, F-actin stained with phalloidin: red, scale bars = 5 μm) together with Poly-Ribo-Seq metrics (RPKM, coverage and TE). Distribution of each peptide (reticular, other cytoplasmic or limited) is indicated. DOI: http://dx.doi.org/10.7554/eLife.03528.010
Figure 3—figure supplement 1.
Figure 3—figure supplement 1.. Validation of smORF translation by tagging assay.
(A) Schematic of the transfection construct into which smORF 5′-UTRs and ORFs (no stop codon) were cloned under the Actin promoter, such as to be fused in frame to a C-terminal FLAG tag, with its own AUG start codon mutated to GCG. (B) Transfection negative controls, plasmid with no ORF (nor AUG), plasmid with the full-length tal transcript (minus 3′-UTR) with ORF-B tagged with FLAG, which has previously been shown not to be translated (Galindo et al., 2007), and a plasmid containing a putative smORF that is transcribed but not translated according to our Poly-Ribo-Seq (Uhg2-ORF1). (C) Immunoblot showing translation of FLAG-tagged smORFs (Table 3) corresponding to predicted sizes, along with β- tubulin loading control. (D) Different subcellular localisations of FLAG-tagged smORFs (green) corroborated by double staining with Mitotracker Red (red): “mitochondrial”, “other cytoplasmic” and “limited” (scale bar = 5 μm). (E) Correlation analysis of colocalisation between FLAG-tagged smORF peptides and Mitotracker Red, error bars represent SD from three experiments. (F) 50% of S2-cell translated smORFs show function in previous RNAi screens (Flymine). (G) Translation of FLAG-tagged pncr009:3L (ncRNA) ORFs 1, 2, and 3 in transfection assay with translational metric values shown (FLAG antibody: green, F-actin stained with phalloidin: red, scale bars = 5 μm). (H) Immunoblot showing detection of FLAG-tagged ORFs from pncr009:3L and CR30055 with predicted sizes (Table 4), along with β-tubulin loading control. (I) Translation of FLAG-tagged uORFs FBtr0072210_1 and FBtr0081720_1 in transfection assays with translational metric values shown (FLAG antibody: green, F-actin stained with phalloidin: red, scale bars = 5 μm). DOI: http://dx.doi.org/10.7554/eLife.03528.011
Figure 3—figure supplement 2.
Figure 3—figure supplement 2.. Poly-Ribo-Seq reveals translation of ORFs in ncRNAs.
(A) Read density plot showing phasing of ribosome footprinting reads in the frame of smORFs within CR30055 and pncr009:3L detected as translated and confirmed by FLAG immunofluorescence translation assay. (B) Correlation of reads obtained by ORFs after Poly-Ribo-Seq (y axis) with reads obtained by sequencing of polysomal fractions before ribosome footprinting (x axis). The correlation is much stronger for canonical long ORFs and putative smORFs (grey) than for ncRNA ORFs (red). Many ncRNA ORFs below the 11.8 RPKM cut-off used to ascertain translation (green dotted line) can show association with polysomes (high Polysomal RNA RPKM), thus translation of ORFs in ncRNAs does not simply stem from non-coding association with polysomes. DOI: http://dx.doi.org/10.7554/eLife.03528.012
Figure 4.
Figure 4.. Bioinformatic indicators of smORFs.
(A) Distribution of phastCons scores for intergenic regions, standard length protein-coding CDSs (longer than 100 aa), S2 cell-translated annotated smORFs, and all annotated smORFs, with fitted normal curves. Green dotted lines indicate the 90th percentile of intergenic phastCons scores (0.55). (B) Relative abundance of particular amino acids in proteins (random expected: black, all CDSs: purple, all annotated smORFs: yellow, and translated smORFs: red). (C and D) Proportion of (C) S2-cell translated (32%) and (D) all smORFs (32%) predicted to contain transmembrane α helices (TMHMM). (E and F) Frequency distribution of smORF peptide lengths for (E) translated and (F) all annotated smORFs with medians shown by red dotted line. DOI: http://dx.doi.org/10.7554/eLife.03528.015
Figure 4—figure supplement 1.
Figure 4—figure supplement 1.. Bioinformatic indicators of smORFs.
(A) Relative abundance of all amino acids in ORFs, (random: grey, all CDS: purple, all annotated smORFs: yellow, and translated annotated smORFs: red). (B) Enrichment of GO molecular function terms (GOrilla) within translated annotated smORFs in S2 cells when compared to translated standard protein-coding ORFs. Main overrepresented terms are structural consitituents of ribosome (p = 3.28E-4), oxidoreductase activity and transmembrane transporter activity (p = 2.77E-5). (CD) Frequency distribution of peptide lengths, phastCons, and relative abundance of particular amino acids of translated (C) uORFs and (D) ncRNA ORFs. Red dotted lines indicate the median amino acid lengths and green dotted lines indicate the 90th percentile cut-off from phastCons of intergenic regions, 0.55 (Figure 4A). DOI: http://dx.doi.org/10.7554/eLife.03528.016

References

    1. Andrews SJ, Rothnagel JA. Emerging evidence for functional peptides encoded by short open reading frames. Nature Reviews Genetics. 2014;15:193–204. doi: 10.1038/nrg3520. - DOI - PubMed
    1. Arava Y, Wang Y, Storey JD, Liu CL, Brown PO, Herschlag D. Genome-wide analysis of mRNA translation profiles in Saccharomyces cerevisiae. Proceedings of the National Academy of Sciences of USA. 2003;100:3889–3894. doi: 10.1073/pnas.0635171100. - DOI - PMC - PubMed
    1. Basrai MA, Hieter P, Boeke JD. Small open reading frames: beautiful needles in the haystack. Genome Research. 1997;7:768–771. doi: 10.1101/gr.7.8.768. - DOI - PubMed
    1. Bazzini AA, Johnstone TG, Christiano R, Mackowiak SD, Obermayer B, Fleming ES, Vejnar CE, Lee MT, Rajewsky N, Walther TC, Giraldez AJ. Identification of small ORFs in vertebrates using ribosome footprinting and evolutionary conservation. The EMBO Journal. 2014;33:981–993. doi: 10.1002/embj.201488411. - DOI - PMC - PubMed
    1. Boerjan B, Cardoen D, Bogaerts A, Landuyt B, Schoofs L, Verleyen P. Mass spectrometric profiling of (neuro)-peptides in the worker honeybee, Apis mellifera. Neuropharmacology. 2010;58:248–258. doi: 10.1016/j.neuropharm.2009.06.026. - DOI - PubMed

Publication types

MeSH terms

Associated data