

A web tool for age-period-cohort analysis of cancer incidence and mortality rates
- PMID: 25146089
- PMCID: PMC4221491
- DOI: 10.1158/1055-9965.EPI-14-0300
A web tool for age-period-cohort analysis of cancer incidence and mortality rates
Abstract
Background: Age-period-cohort (APC) analysis can inform registry-based studies of cancer incidence and mortality, but concerns about statistical identifiability and interpretability, as well as the learning curves of statistical software packages, have limited its uptake.
Methods: We implemented a panel of easy-to-interpret estimable APC functions and corresponding Wald tests in R code that can be accessed through a user-friendly Web tool.
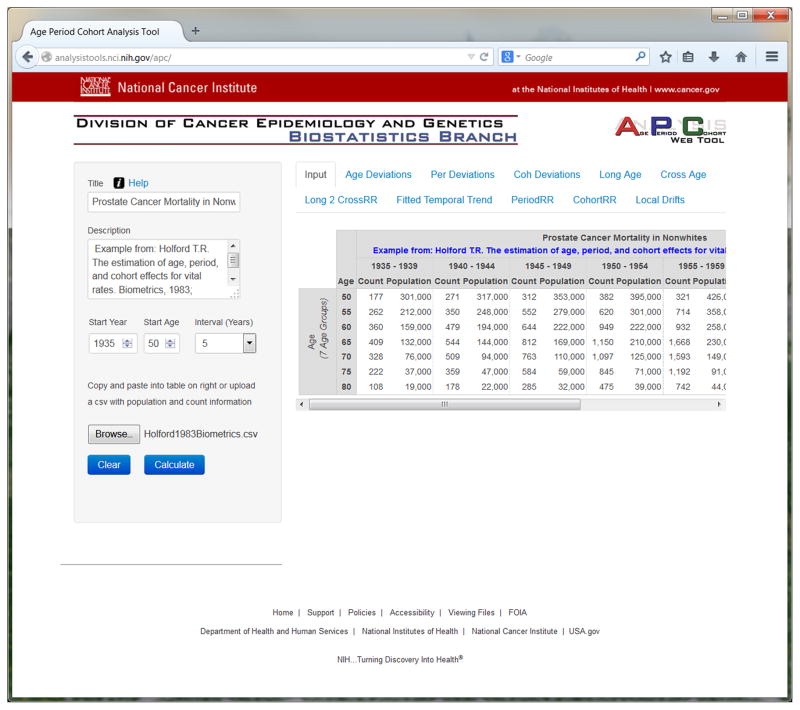
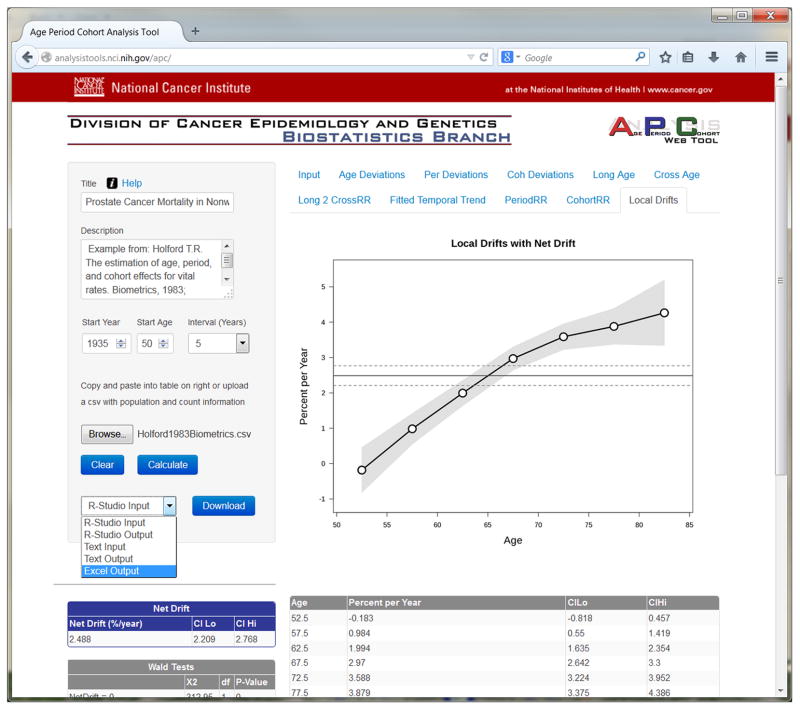
Results: Input data for the Web tool consist of age-specific numbers of events and person-years over time, in the form of a rate matrix of paired columns. Output functions include model-based estimators of cross-sectional and longitudinal age-specific rates, period and cohort rate ratios that incorporate the overall annual percentage change (net drift), and estimators of the age-specific annual percentage change (local drifts). The Web tool includes built-in examples for teaching and demonstration. User data can be input from a Microsoft Excel worksheet or by uploading a comma-separated-value file. Model outputs can be saved in a variety of formats, including R and Excel.
Conclusions: APC methodology can now be carried out through a freely available user-friendly Web tool. The tool can be accessed at http://analysistools.nci.nih.gov/apc/.
Impact: The Web tool can help cancer surveillance researchers make important discoveries about emerging cancer trends and patterns.
©2014 American Association for Cancer Research.
Conflict of interest statement
CONFLICTS OF INTEREST
The authors have no potential conflicts of interests.
Figures
References
-
- Curado MP, Edwards B, Shin HR, Ferlay J, Heanue M, Boyle P, et al., editors. Cancer Incidence in Five Continents. IX. Lyon, France: International Agency for Research on Cancer; 2009.
-
- Bray F, Jemal A, Grey N, Ferlay J, Forman D. Global cancer transitions according to the Human Development Index (2008–2030): a population-based study. Lancet Oncol. 2012;13(8):790–801. - PubMed
-
- Devesa SS, Donaldson J, Fears T. Graphical presentation of trends in rates. American journal of epidemiology. 1995;141(4):300–4. - PubMed
-
- Robertson C, Boyle P. Age-period-cohort models of chronic disease rates. II: Graphical approaches. Statistics in medicine. 1998;17(12):1325–39. - PubMed
Publication types
MeSH terms
Grants and funding
LinkOut - more resources
Full Text Sources
Other Literature Sources
