. 2014;15(7):R89.
doi: 10.1186/gb-2014-15-7-r89.

Host lifestyle affects human microbiota on daily timescales

Host lifestyle affects human microbiota on daily timescales

Lawrence A David et al. Genome Biol. 2014.

Erratum in

Abstract

Background: Disturbance to human microbiota may underlie several pathologies. Yet, we lack a comprehensive understanding of how lifestyle affects the dynamics of human-associated microbial communities.

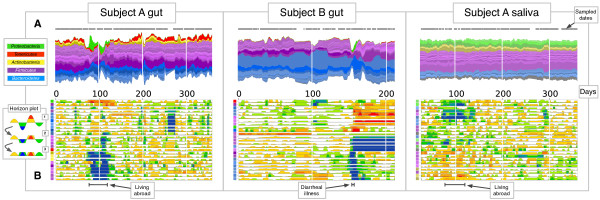
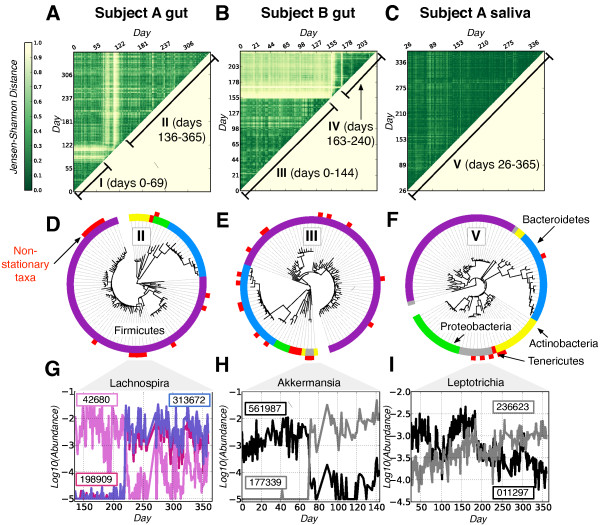
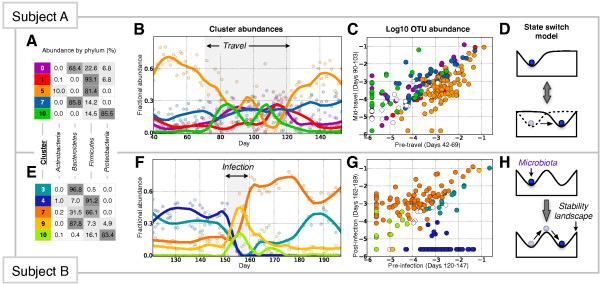
Results: Here, we link over 10,000 longitudinal measurements of human wellness and action to the daily gut and salivary microbiota dynamics of two individuals over the course of one year. These time series show overall microbial communities to be stable for months. However, rare events in each subjects’ life rapidly and broadly impacted microbiota dynamics. Travel from the developed to the developing world in one subject led to a nearly two-fold increase in the Bacteroidetes to Firmicutes ratio, which reversed upon return. Enteric infection in the other subject resulted in the permanent decline of most gut bacterial taxa, which were replaced by genetically similar species. Still, even during periods of overall community stability, the dynamics of select microbial taxa could be associated with specific host behaviors. Most prominently, changes in host fiber intake positively correlated with next-day abundance changes among 15% of gut microbiota members.

Conclusions: Our findings suggest that although human-associated microbial communities are generally stable, they can be quickly and profoundly altered by common human actions and experiences.


Figures

Figure 1
Figure 1
Gut and salivary microbiota dynamics in two subjects over 1 year. (A) Stream plots showing OTU fractional abundances over time. Each stream represents an OTU and streams are grouped by phylum: Firmicutes (purple), Bacteroidetes (blue), Proteobacteria (green), Actinobacteria (yellow), and Tenericutes (red). Stream widths reflect relative OTU abundances at a given time point. Sampled time points are indicated with gray dots over each stream plot. (B) Horizon graphs of most common OTUs’ abundance over time. Horizon graphs enable rapid visual comparisons between numerous time series [21]. Graphs are made by first median-centering each OTU time series and dividing the curve into colored bands whose width is the median absolute deviation (Inset, step 1). Next, the colored bands are overlaid (step 2) and negative values are mirrored upwards (step 3). Thus, warmer regions indicate date ranges where a taxon exceeds its median abundance, and cooler regions denote ranges where a taxon falls below its median abundance. Colored squares on the vertical axis correspond to stream colors in (A). Time series in both the stream plots and horizon graphs were smoothed using Tukey’s running median. Lower black bars span Subject A’s travel abroad (days 71 to 122) and Subject B’s Salmonella infection (days 151 to 159).
Figure 2
Figure 2
Stability testing of gut and saliva microbiota time series. (A-C) Pairwise Jensen Shannon Distances between samples from Subject A’s gut (A), Subject B’s gut (B), and Subject A’s saliva (C). Dark green regions indicate date ranges with similar microbiota. To quantify how stable individual microbial taxa were across the labeled date ranges, we performed the Augmented Dickey Fuller (ADF) test, which evaluated the null hypothesis that a given OTU is non-stationary (that is, the OTU tends to return to an equilibrium value). The majority of tested OTUs were stationary according to the ADF test (88%, 85%, 84%, 79%, and 94% for date ranges I-V, P <0.05). (D-F) Phylogeny of stationary and non-stationary OTUs. Inner rings denote phyla (the Firmicutes, Bacteroidetes, Proteobacteria, Actinobacteria and Tenericutes are colored purple, blue, green, yellow, and red, respectively). Outer rings are white for stationary OTUs and red for non-stationary ones. Non-stationary taxa clustered phylogenetically for date ranges II (D), III (E), and V (F) (P <0.05, P-test), supporting the hypothesis that closely-related taxa are more likely to be in competition. (G-I) Time series of closely-related, non-stationary OTUs (Greengenes prokMSA ids given in boxes). An artificial abundance floor of 1e-5 was added to improve visibility. Shown are members of the genus Lachnospira over date range II (G), the genus Akkermansia over date range III (H), and the genus Leptotrichia over date range V (I). The summed abundances of the selected Lachnospira and Leptotrichia are stationary over the given date ranges (P <0.05, ADF test).
Figure 3
Figure 3
Dynamics of major OTU clusters across major perturbations. Highly abundant OTUs were clustered by their dynamics across Subject A’s travel period (A-D) and Subject B’s acute enteric infection (E-H). Clusters were produced separately for the two environments; see Methods for more details. (A,E) Taxonomic composition of major clusters (fractional abundance exceeds 10% for more than 3 days). (B,F) Cluster abundances over time (shaded points) and trend lines (solid) fit using LOESS smoothing, colored using the same scheme as in (A,E). Subject A’s travel abroad (days 71 to 122) and Subject B’s enteric infection (days 151 to 159) are shaded in gray. (C,G) Median log10(abundance) of OTUs in each cluster before and after perturbation. OTUs are colored by cluster membership, except for uncolored OTUs belonging to clusters not plotted in (A,E). OTU detection limits were set to the minimum fractional abundance observed in each subject’s time series (1e-5.8 for Subject A and 1e-5.6 for Subject B). (D,H) Cartoon of microbiome state models, in which microbiota are considered to be balls in a landscape shaped by environmental factors [24]. Subject A’s travel-related microbiota shift is consistent with a model where environmental disturbances cause state changes (D), while Subject B’s infection-related shift is consistent with state transitions caused by direct community perturbations (H).
Figure 4
Figure 4
Phylogenetic evidence for competing gut bacterial taxa. OTUs clustered by their dynamics across Subject B’s enteric infection (Figure 3) were plotted on a reference phylogeny built using 16S rRNA sequences (Methods). Taxonomic assignments for each OTU are shown on the inner ring and correspond with the color coding from Figure 1. Taxa associated with increasing (Cluster 7, orange) or decreasing (Cluster 4, blue) abundance after infection are indicated on the outer ring. A monophyletic subtree within the Firmicutes (arrowed and shaded) is significantly associated with taxa from the two clusters (P <0.001, Fisher’s Exact Test).

Similar articles

Cited by

References

    1. Cho I, Yamanishi S, Cox L, Methé BA, Zavadil J, Li K, Gao Z, Mahana D, Raju K, Teitler I, Li H, Alekseyenko AV, Blaser MJ. Antibiotics in early life alter the murine colonic microbiome and adiposity. Nature. 2012;488:621–626. doi: 10.1038/nature11400. - DOI - PMC - PubMed
    1. Turnbaugh PJ, Ridaura VK, Faith JJ, Rey FE, Knight R, Gordon JI. The effect of diet on the human gut microbiome: a metagenomic analysis in humanized gnotobiotic mice. Sci Transl Med. 2009;1:6ra14. doi: 10.1126/scitranslmed.3000322. - DOI - PMC - PubMed
    1. Buffie CG, Jarchum I, Equinda M, Lipuma L, Gobourne A, Viale A, Ubeda C, Xavier J, Pamer EG. Profound alterations of intestinal microbiota following a single dose of clindamycin results in sustained susceptibility to Clostridium difficile-induced colitis. Infect Immun. 2012;80:62–73. doi: 10.1128/IAI.05496-11. - DOI - PMC - PubMed
    1. Turnbaugh PJ, Ley RE, Mahowald MA, Magrini V, Mardis ER, Gordon JI. An obesity-associated gut microbiome with increased capacity for energy harvest. Nature. 2006;444:1027–1131. doi: 10.1038/nature05414. - DOI - PubMed
    1. Devkota S, Wang Y, Musch MW, Leone V, Fehlner-Peach H, Nadimpalli A, Antonopoulos DA, Jabri B, Chang EB. Dietary-fat-induced taurocholic acid promotes pathobiont expansion and colitis in Il10-/- mice. Nature. 2012;487:104–108. - PMC - PubMed

Publication types