. 2014 Oct 3;346(6205):89-93.
doi: 10.1126/science.1252945. Epub 2014 Aug 21.

Aging. Aging-induced type I interferon response at the choroid plexus negatively affects brain function

Affiliations

Aging. Aging-induced type I interferon response at the choroid plexus negatively affects brain function

Kuti Baruch et al. Science. .

Abstract

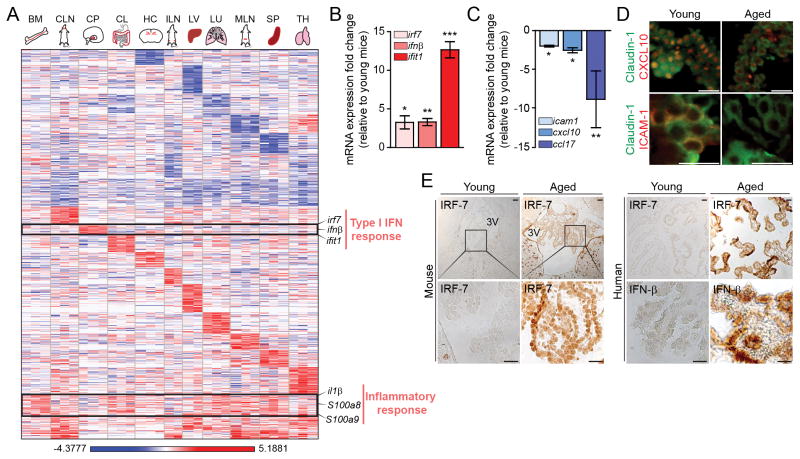
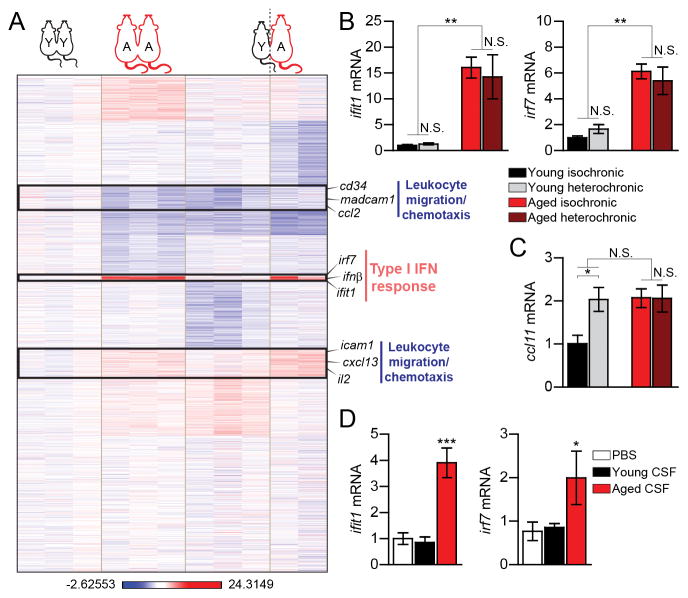
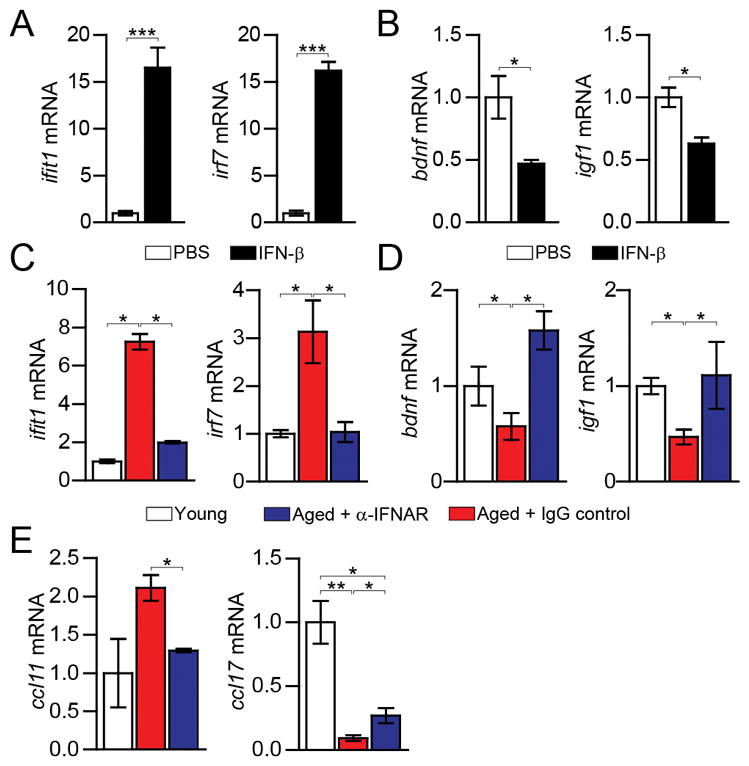
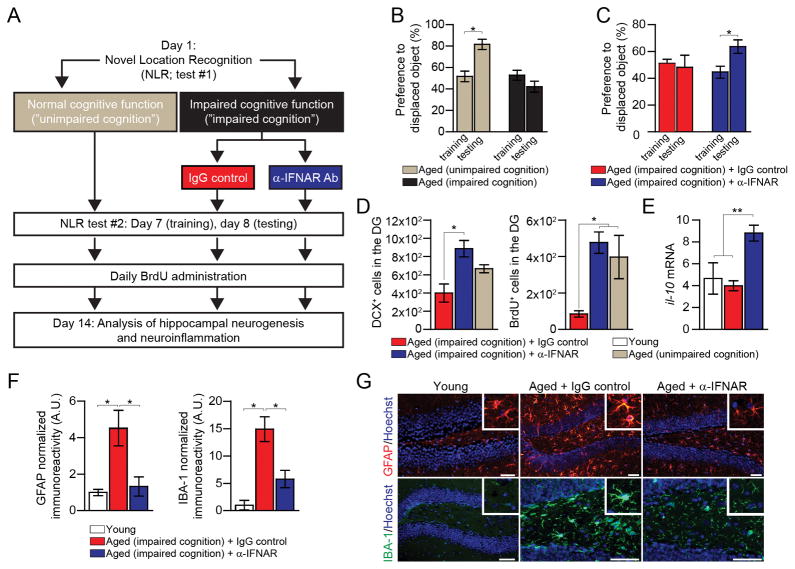
Aging-associated cognitive decline is affected by factors produced inside and outside the brain. By using multiorgan genome-wide analysis of aged mice, we found that the choroid plexus, an interface between the brain and the circulation, shows a type I interferon (IFN-I)-dependent gene expression profile that was also found in aged human brains. In aged mice, this response was induced by brain-derived signals, present in the cerebrospinal fluid. Blocking IFN-I signaling within the aged brain partially restored cognitive function and hippocampal neurogenesis and reestablished IFN-II-dependent choroid plexus activity, which is lost in aging. Our data identify a chronic aging-induced IFN-I signature, often associated with antiviral response, at the brain's choroid plexus and demonstrate its negative influence on brain function, thereby suggesting a target for ameliorating cognitive decline in aging.


Figures

Fig. 1
Fig. 1. Type I interferon expression program in the aging CP
(A) Heat map and hierarchical clustering of gene expression in bone marrow (BM), cervical lymph nodes (CLN), choroid plexus (CP), colon (CL), hippocampus (HC), inguinal lymph nodes (ILN), liver (LV), lung (LU), mesenteric lymph nodes (MLN), spleen (SP) and thymus (TH) of aged mice, analyzed by high-throughput RNA-sequencing. Results are displayed as log of differential expression relative to young controls (n=2–3). (B–C) mRNA abundance of type I and type II IFN-dependent genes in the CP of aged animals, presented as fold change relative to expression in young mice CPs (n=10 mice per group; bars represent mean ± SEM; *, P < 0.05; **, P < 0.01;***, P < 0.001; Student’s t test for each pair; data are representative of at least three independent experiments performed). (D) Representative images of brain sections of young and aged mice, immunostained for Claudin-1 (marking epithelial tight junctions; in green), and either CXCL10 or ICAM1 (in red) (Scale bar, 25μm). (E) Representative micrographs of immunohistochemical staining for IRF7 in young and aged mice, and for IRF7 and IFN-β in young and aged human postmortem CPs (Scale bar, 50μm).
Fig. 2
Fig. 2. Effect of signals from the cerebrospinal fluid, but not from the blood circulation, on type I IFN-dependent genes in the CP
(A) Heat map and hierarchical clustering of gene expression in the CPs of aged (‘A’) and young (‘Y’), iso- (‘A-A’, ‘Y-Y’) and hetero- (‘A–Y’) chronic parabionts, analyzed by RNA-sequencing, displayed as log of differential expression relative to an average expression in young-isochronic CP (n=2–3). (B–C) mRNA expression of type I IFN-dependent genes, ifit1 and irf7 (B) and the type II IFN-dependent gene, ccl11 (C) in the CP of parabiotic mice (n=6–8 mice per group). (D) mRNA expression of ifit1 and irf7 in primary cultures of CP cells treated with PBS or CSF aspirated from young (3 months old) or aged (22 months old) mice (n=4–5 per group). Throughout the figure, bars represent mean ± SEM; *, P < 0.05; **, P < 0.01; ***, P < 0.001; one-way ANOVA with Newmann-Kleus post-hoc test.
Fig. 3
Fig. 3. Restored CP function after neutralization of the age-induced type I IFN response in the brain
(A–B) ifit1, irf7 (A), and bdnf and igf1 (B) mRNA expression in CP epithelial cells cultured for 24h with murine IFN-β (n=4 per group; bars represent mean ± SEM; *, P < 0.05; ***, P < 0.001, Student’s t test). (C) ifit1 and irf7 mRNA expression in the CP 3 days after α-IFNAR or IgG control i.c.v. administration. (D–E) bdnf and igf1 (D) and ccl11 and ccl17 (E) mRNA expression in the CP 7 days after α-IFNAR or IgG control i.c.v. administration (n=6–7 per group). Throughout the figure, bars represent mean ± SEM; *, P < 0.05; **, P < 0.01; one-way ANOVA with Newmann-Kleus post-hoc test.
Fig. 4
Fig. 4. Restored brain function after neutralization of the age-induced type I IFN response in the brain
(A) Scheme illustrating the experimental design. (B) Performance of “cognitively unimpaired” and “cognitively impaired” aged mice in the NLR task (n=5–18 per group). (C) Performance of α-IFNAR and control IgG injected cognitively-impaired aged mice in the NLR task (n=5–6 per group). (D–E) Analysis of the hippocampal dentate gyrus (DG) of α-IFNAR or control IgG i.c.v.-injected “cognitively impaired” aged mice, and of young and aged “cognitively unimpaired” mice, 14 days after treatment (n=4–6 per group). Quantification of hippocampal DCX and BrdU labeled newly-born neurons (notably, in this experiment, young mice showed significantly higher numbers of DCX and BrdU labeled cells, 16832±873 and 4403±51, respectively) (D); il-10 mRNA expression in the hippocampus (E). (F–G) Quantification (F), and representative images (G), of GFAP and IBA-1 staining intensity in hippocampal brain sections immunostained for GFAP (in red), IBA-1 (in green), and Hoechst nuclear staining (in blue) (scale bar, 50μm). Throughout the figure, bars represent mean ± SEM; *, P < 0.05; **, P < 0.01; one-way ANOVA with Newmann-Kleus post-hoc test.

Comment in

References

    1. Stranahan AM, Mattson MP. Nat Rev Neurosci. 2012;13:209–216. - PMC - PubMed
    1. Yeoman M, Scutt G, Faragher R. Nat Rev Neurosci. 2012;13:435–445. - PubMed
    1. Villeda SA, et al. Nature. 2011;477:90–94. - PMC - PubMed
    1. Villeda SA, et al. Nat Med. 2014;20:659–663. - PMC - PubMed
    1. Katsimpardi L, et al. Science. 2014;344:630–634. - PMC - PubMed

Publication types