. 2014 Sep 15:370:75-95.
doi: 10.1016/j.ijms.2014.06.016.

Ion mobility spectrometry: A personal view of its development at UCSB

Affiliations

Ion mobility spectrometry: A personal view of its development at UCSB

Michael T Bowers. Int J Mass Spectrom. .

Abstract

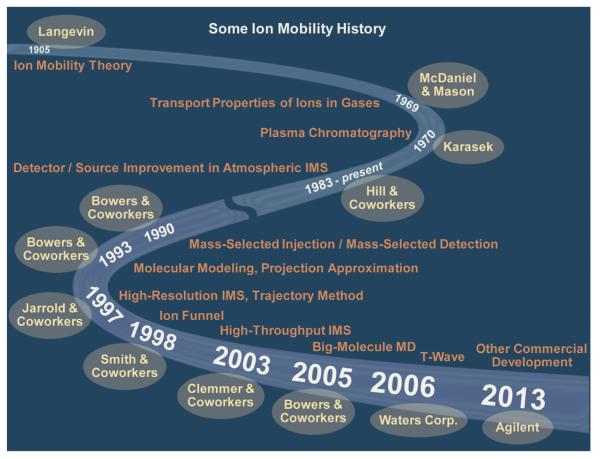
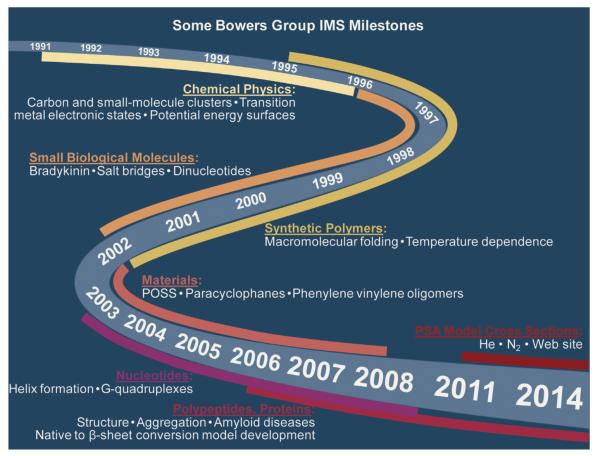
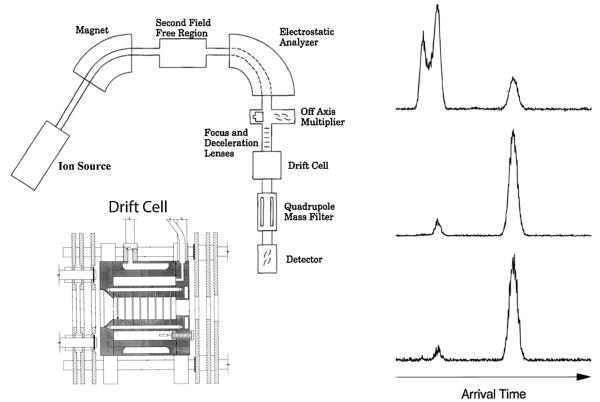
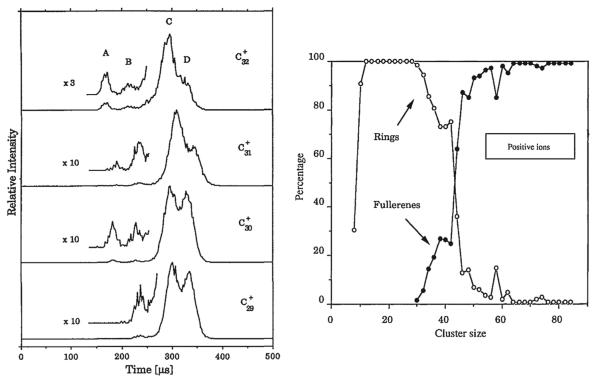
Ion mobility is not a newly discovered phenomenon. It has roots going back to Langevin at the beginning of the 20th century. Our group initially got involved by accident around 1990 and this paper is a brief account of what has transpired here at UCSB the past 25 years in response to this happy accident. We started small, literally, with transition metal atomic ions and transitioned to carbon clusters, synthetic polymers, most types of biological molecules and eventually peptide and protein oligomeric assembly. Along the way we designed and built several generations of instruments, a process that is still ongoing. And perhaps most importantly we have incorporated theory with experiment from the beginning; a necessary wedding that allows an atomistic face to be put on the otherwise interesting but not fully informative cross section measurements.

Keywords: Bio-macromolecules; Instrumentation; Ion mobility; Mass spectrometry; Modeling; Structure.


Figures

Fig. 1
Fig. 1
Major contributions and approximate dates to advances in IMS. Names are given where appropriate. The advances noted are limited to drift cell IMS with the exception of the T-wave development by Waters Corp.
Fig. 2
Fig. 2
Major milestones for the evolution of IMS in the Bowers group at UCSB. Approximate dates are given in the center ribbon with time windows for the features noted given by the outer ribbons.
Fig. 3
Fig. 3
Left panel: At top a schematic of the overall instrument with the components labeled. At bottom a schematic of the temperature-dependent drift cell. Right panel: ATD for V+ atomic ions; top from electron impact on VCl4, middle from CID of VCl+ injected at high energy; bottom from VO+ injected at high energy. The peak at longest time in all cases corresponds to ground state 5D 3 (3d4), the doublet in the top ATD to 3F (3d34s1) and 5F (3d34s1) excited states and the shorter time peaks in the lower two ATDs to the 5F (3d34s1) excited state. Figure adapted in part from Refs. [13] and [37].
Fig. 4
Fig. 4
Left panel: ATDs for C29+, C30+, C31+ and C32+. ATD features are A = fullerene, B = graphitic, C = tricyclic planar ring, D = bicyclic planar ring. Right panel: plot of % total abundance for rings and fullerenes versus cluster size for Cn+ cluster ions. Figure adapted from Refs. [53] and [51].
Fig. 5
Fig. 5
Left panel: Isomeric forms of C36. Right panel: Plot of total % of isomer abundance versus cluster size for linear, ring, graphitic and fullerene isomers for Cn-cluster ions. Figure adapted from Ref. [52].
Fig. 6
Fig. 6
Upper left: Mass spectrum from a carbon laser desorption source with a 90% He and 10% H2 expansion gas. Lower left: ATDs of the C18Hn+ peaks for n = 0 to 5. Lower middle: structures for various isomers of C18H4+. Right panels: plot of percent linear isomer versus n for the three cases shown. Figure adapted in part from Ref. [53].
Fig. 7
Fig. 7
Upper left: K0−1 versus n in Na+(PEG)n polymers. Upper right: cross section for Na+(PEG)17 versus temperature. Lower left: lowest energy structures of Na+(PEG)9 and (Gly)4H+. In both structures white represents hydrogen, gray oxygen or nitrogen, black carbon. Lower right: cross section versus temperature for Na+(PEG)17, Na+(PEG)13 and Na+(PEG)9. Open circles experiment and lines theory (see text). Figure adapted from Refs. [28] and [64].
Fig. 8
Fig. 8
Left panel: schematic of MALDI instrument. Components noted on upper diagram. Right panel: schematic representations of POSS cages. Silicon atoms are open circles and oxygen atoms, gray circles. Ligands cap all silicon atoms. Figure adapted from Refs. [76] and [77].
Fig. 9
Fig. 9
Upper left: ATDs of dTG- and dGT- at 300 and 85 K. Lower left: structures corresponding to the features in the ATDs. The open structures come at longest times. Upper right: schematic potential energy surface showing how the ATDs evolve with temperature when injected into the cell at high temperature. Lower right: lnkf versus 1/T plots obtained from a kinetic fitting of the ATDs as a function of temperature (see text). Figure adapted from Ref. [82].
Fig. 10
Fig. 10
Sequence of ATDs and lowest-energy structures from MD simulations for the duplexes shown. The cross sections and structural assignments are given in Table 3. Figure adapted from Ref. [92].
Fig. 11
Fig. 11
Upper panel: Mass spectrum of self-assembled guanosine. Lower panel: structures of the three peaks in the ATD of the nominal (4dG + NH4)+ mass spectral peak. Figure adapted from Ref. [102].
Fig. 12
Fig. 12
Upper panel: common forms of G-quadruplexes formed by stacking of linked G-quartets. Lower panel: ATDs shown (at left) a stabilized form of a G-quadruplex (largest peak at early time) and (at right) a destabilized G-quadruplex (ATD peak at longer time). Energy destabilizes but addition of NH4+ between G-quartet layers or planar ligands externally stacked stabilizes the G-quadruplex. Figure adapted from Ref. [105].
Fig. 13
Fig. 13
(Top) Cross-sectional view of entire electrospray ion mobility mass spectrometer as viewed from the top. (Bottom) Perspective cross-sectional view of source, funnel, and cell. (a) and (b) vacuum chambers, (c) pump ports, (d) source flange, (e) ion funnel, (f) drift cell, (g) quadrupole mass analyzer, (h) conversion dynode, (i) detector, (j) capillary heating block, (k) insulator, (l) funnel first section, (m) funnel second section, (n) funnel third section, (o) funnel flange, (p) hat flange, (q) second pump stage, (r) cell body, (s) cell end cap, (t) ceramic ring, (u) guard rings, and (v), (w), (x) ion optics. Figure reproduced from ref. [93].
Fig. 14
Fig. 14
The left panel shows the mass spectra of wild-type Aβ42 and its Pro19 alloform taken from an unfiltered solution at 30 μM concentration near pH 8. The putative monomer charge states of −2, −3, −4, and −5 are indicated along with a −5/2 peak and, in the case of the Pro19alloform, a −7/3 peak. The −5/2 peak would correspond to a putative −5 dimer and the small −7/3 peak to a −7 trimer. The two insets are high-resolution spectra of the −3 and −2 charge states. The right panel shows arrival time distributions for the two peptides for the −5/2 charge states at the injection energies indicated. The letter designations given for the features are D = dimer, Te = tetramer, and H = hexamer. The figure was adapted from Ref. [116].
Fig. 15
Fig. 15
The ATD of z/n = 5/2 Aβ42 with structural designations as indicated. Figure adapted from Ref. [117].
Fig. 16
Fig. 16
Mechanism of oligomerization and eventual fibril formation for Aβ42 and for Aβ40. For Aβ40 the key structure is the tetramer that resists further monomer or dimer addition. In Aβ42 an `open' tetramer promotes the formation of the planar hexamer (paranucleus) and the stacked dodecamer, which resists further reaction. For Aβ40 the tetramer eventually forms fibrils, but these were not observed in our experiments. For Aβ42 a rate-limiting slow α- to β-sheet transformation may occur for the dodecamer, but this was not explicitly observed in our experiments. Fibril formation was indirectly observed through macroscopic clogging of the spray tips used for Aβ42. Figure adapted from Ref. [117].
Fig. 17
Fig. 17
Overview of the instrument. The length of the drift tube is 2.00 m. The drawing is to scale. Reproduced from Ref. [125].
Fig. 18
Fig. 18
High-resolution IMS spectra of protonated bradykinin ions formed by ESI. Previous, lower resolution spectra are shown above. (a) z/n = +1, (b) z/n = +2, (c) z/n = +3/2, (d) z/n = +3, where z is the charge and n is the aggregate number (n = 1 is monomer, n = 2 is dimer, etc.). Reproduced from Ref. [125].
Fig. 19
Fig. 19
The top panel shows self-assembly starting at the folded monomer (left) and proceeding to soluble peptide assemblies of increasing mass (right). Soluble peptide oligomers with identical mass (that is, number of monomer units n) can assume different conformations, such as globular (bottom row) or β-strand conformations (top row) with different collision cross-sections. Successively mass-extracting a specific aggregation state from the solution-phase distribution and subsequent determination of its collision cross-section revealed the self-assembly pathway that occurred in solution (see arrow). The bottom panels show plots of measured collision cross sections as a function of the oligomer number n. YGGFL self-assembled isotropically with cross-sections that increased as n 2/3 (line) V = volume. NNQQNY followed an isotropic assembly up to the octamer. Fibril-like β-sheet conformations emerged at the nonamer and became prevalent at the nonadecamer. Figure adapted from Ref. [132].
Scheme 1
Scheme 1
Outcomes from energizing a specific carbon cluster.

Similar articles

Cited by

References

    1. Franklin B. A letter of Benjamin Franklin, Esq; to Mr. Peter Collinson, F. R. S. concerning an electrical kite. Phil. Trans. 1751;47:565–567.
    1. Coulomb CA. Mém. de l'Acad. Vol. 616. Paris: 1795.
    1. Thomson JJ, Rutherford E. On the passage of electricity through gases exposed to Röntgen rays. Philos. Mag. 1896;42:392–407.
    1. Rutherford E. The velocity and rate of recombination of the ions of gases exposed to Röntgen radiation. Philos. Mag. 1897;44:422–440.
    1. Langevin P. Sur la mobilité des ions les gaz. Comptes Rendus. 1902;134:646–649.