. 2014 Aug 22:5:4684.
doi: 10.1038/ncomms5684.

Strong effects of genetic and lifestyle factors on biomarker variation and use of personalized cutoffs

Affiliations

Strong effects of genetic and lifestyle factors on biomarker variation and use of personalized cutoffs

Stefan Enroth et al. Nat Commun. .

Abstract

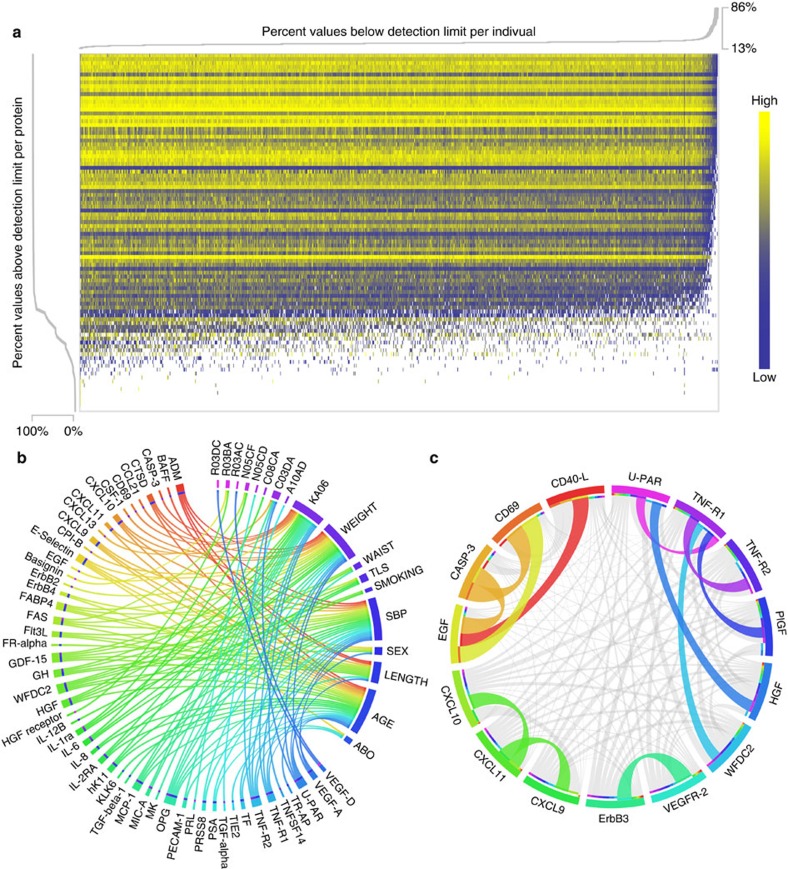
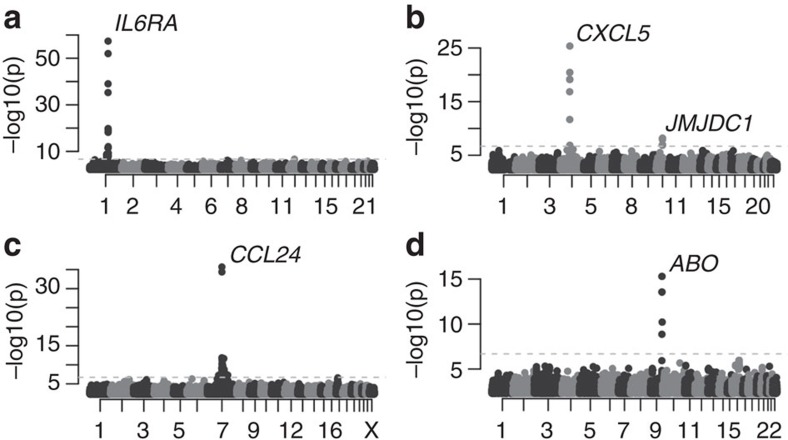
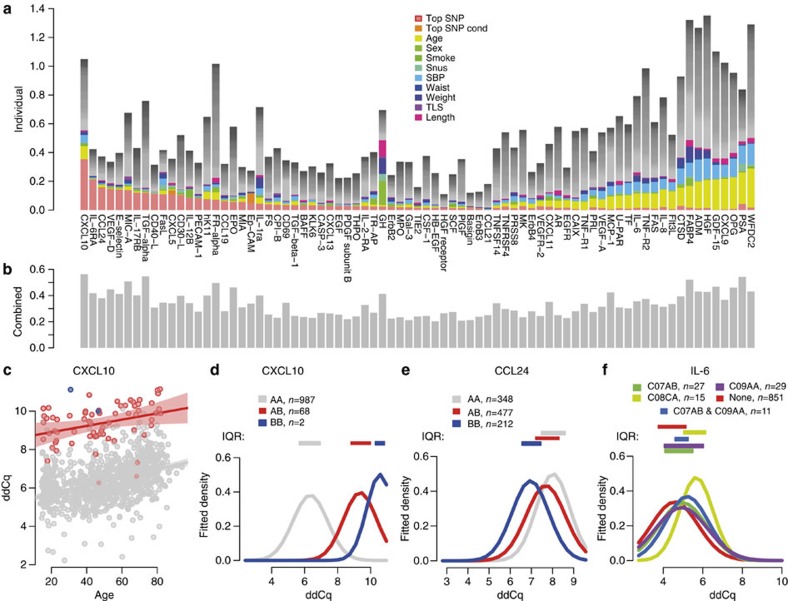
Ideal biomarkers used for disease diagnosis should display deviating levels in affected individuals only and be robust to factors unrelated to the disease. Here we show the impact of genetic, clinical and lifestyle factors on circulating levels of 92 protein biomarkers for cancer and inflammation, using a population-based cohort of 1,005 individuals. For 75% of the biomarkers, the levels are significantly heritable and genome-wide association studies identifies 16 novel loci and replicate 2 previously known loci with strong effects on one or several of the biomarkers with P-values down to 4.4 × 10(-58). Integrative analysis attributes as much as 56.3% of the observed variance to non-disease factors. We propose that information on the biomarker-specific profile of major genetic, clinical and lifestyle factors should be used to establish personalized clinical cutoffs, and that this would increase the sensitivity of using biomarkers for prediction of clinical end points.


Conflict of interest statement

Ulf Gyllensten and Stefan Enroth are authors on a patent application entitled 'Determination and analysis of Biomarkers in clinical samples'; serial number GB1410956.5 (2014). The remaining authors declare no competing financial interests.

Figures

Figure 1
Figure 1. Characteristics of the PEA measurements.
(a) Intensities of PEA values and proportion of proteins and individuals above detection limit. In the heatmap, individuals are in columns and proteins are in rows. Heatmap colours represent ddCq-values ranging from low (blue) to high (yellow) with measurements below detection limit coded white. (b) Significant covariates in relation to each protein. Covariates are listed from the upper right part of the circle (12 o'clock to 4) and connections illustrate significant (P-value <0.05, Bonferroni adjusted) contributions to PEA variance. (c) PEA to PEA correlations, coloured connections represent a correlation coefficient (R2) greater than 0.5. The width of the connection reflects the magnitude of the squared correlation coefficients. All correlations coefficients (R) were positive.
Figure 2
Figure 2. Manhattan plots of GWAS results.
(a) IL-6RA (b) CXCL5 (c) CCL24 and (d) E-selectin. X axis labels refer to human chromosomes listed 1–22 and X. P-values were calculated from 1df Wald statistics χ2 values using 971 individuals.
Figure 3
Figure 3. Covariates and protein biomarkers.
(a) Variance explained by each of the covariates for the set of 77 biomarkers with measurable variability with the 11 most important covariates coloured. The combined effect of the remaining covariates is shown in grey, assuming independence in effect between covariates. (b) The percent of the variance explained by the full set of covariates studied for the 77 proteins, using a combined model. (c) Abundance of CXCL10, expressed as ddCq-values, in relation to age when stratified by genotype at rs11548618; AA (grey), AB (red) and BB (blue). Shadowed areas represent the 95% confidence interval in a linear model predicting ddCq from age. (d) Fitted normal distribution densities based on mean and standard deviation in ddCq-values for CXCL10, split by the rs11548618 genotype. (e) Fitted normal distribution densities based on mean and standard deviation in ddCq-values for CCL24 split by the rs6946822 genotype. (f) Fitted normal distribution densities based on mean and standard deviation in ddCq-values for IL-6 split by use of hypertension medications. Only groups where there are at least 10 individuals are shown. C07AB: β-blocking agents, selective. C08CA: dihydropyridine derivatives. C09AA: ACE inhibitors, plain. (df) Interquartile ranges indicated with coloured boxes above the curves.

References

    1. Prensner J. R., Rubin M. A., Wei J. T. & Chinnaiyan A. M. Beyond PSA: the next generation of prostate cancer biomarkers. Sci. Trans. Med. 4, 127rv123 (2012). - PMC - PubMed
    1. Scholler N. & Urban N. CA125 in ovarian cancer. Biomark. Med. 1, 513–523 (2007). - PMC - PubMed
    1. Yue C. et al.. The effects of adalimumab and methotrexate treatment on peripheral Th17 cells and IL-17/IL-6 secretion in rheumatoid arthritis patients. Rheumatol. Int. 30, 1553–1557 (2010). - PubMed
    1. Hanahan D. & Weinberg R. A. Hallmarks of cancer: the next generation. Cell 144, 646–674 (2011). - PubMed
    1. Cao Y., DePinho R. A., Ernst M. & Vousden K. Cancer research: past, present and future. Nat. Rev. Cancer 11, 749–754 (2011). - PubMed

Publication types