An official website of the United States government
The .gov means it’s official.
Federal government websites often end in .gov or .mil. Before
sharing sensitive information, make sure you’re on a federal
government site.
The site is secure.
The https:// ensures that you are connecting to the
official website and that any information you provide is encrypted
and transmitted securely.
1 Division of Signaling and Gene Expression, La Jolla Institute for Allergy and Immunology, La Jolla, CA 92037, USA; Division of Vaccine Discovery, La Jolla Institute for Allergy and Immunology, La Jolla, CA 92037, USA; Department of Cancer Biology, The Scripps Research Institute, Jupiter, FL 33458, USA.
2 Division of Vaccine Discovery, La Jolla Institute for Allergy and Immunology, La Jolla, CA 92037, USA.
3 Department of Cancer Biology, The Scripps Research Institute, Jupiter, FL 33458, USA.
4 Division of Cell Biology, La Jolla Institute for Allergy and Immunology, La Jolla, CA 92037, USA.
5 Division of Signaling and Gene Expression, La Jolla Institute for Allergy and Immunology, La Jolla, CA 92037, USA.
6 Division of Vaccine Discovery, La Jolla Institute for Allergy and Immunology, La Jolla, CA 92037, USA. Electronic address: shane@lji.org.
7 Department of Cancer Biology, The Scripps Research Institute, Jupiter, FL 33458, USA. Electronic address: mpipkin@scripps.edu.
Classical genetic approaches to examine the requirements of genes for T cell differentiation during infection are time consuming. Here we developed a pooled approach to screen 30-100+ genes individually in separate antigen-specific T cells during infection using short hairpin RNAs in a microRNA context (shRNAmir). Independent screens using T cell receptor (TCR)-transgenic CD4(+) and CD8(+) T cells responding to lymphocytic choriomeningitis virus (LCMV) identified multiple genes that regulated development of follicular helper (Tfh) and T helper 1 (Th1) cells, and short-lived effector and memory precursor cytotoxic T lymphocytes (CTLs). Both screens revealed roles for the positive transcription elongation factor (P-TEFb) component Cyclin T1 (Ccnt1). Inhibiting expression of Cyclin T1, or its catalytic partner Cdk9, impaired development of Th1 cells and protective short-lived effector CTL and enhanced Tfh cell and memory precursor CTL formation in vivo. This pooled shRNA screening approach should have utility in numerous immunological studies.
Figure 1. Optimization of conditions for a pooled screening approach using shRNAmirs in CD8 + …
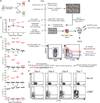
Figure 1. Optimization of conditions for a pooled screening approach using shRNAmirs in CD8+ T cells in vivo to identify genes that regulate CTL differentiation during infection
(A) A conceptual representation depicting the principle of the pooled screening strategy. (B) Scheme for the shRNAmir screen using P14 cells and LCMV infection. (C) Scheme for quantifying shRNAmirs. DNA libraries generated by PCR of the integrated shRNAmir provirus are analyzed by deep sequencing to quantify shRNA representation in the cell subsets. (D) Total P14 cell numbers recovered in the spleen in the presence or absence of LCMV infection. Error bars indicate standard deviations. (E) Blimp1-YFPhi, CD25hi KLRG-1hi and IL-7Rαhi cell frequencies at the indicated time points after infection. Symbols represent values from individual mice. Red = LCMV infected mice. Black = uninfected mice. (F) Representative flow cytometry plots of KLRG-1 and IL-7Rα staining on P14 cells under conditions used for screening.
Figure 2. A pooled RNAi screen in…
Figure 2. A pooled RNAi screen in CD8 + T cells in vivo identifies potential…
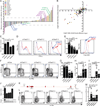
Figure 2. A pooled RNAi screen in CD8+ T cells in vivo identifies potential regulators of effector and memory precursor CTL formation
(A) Relative enrichment of shRNAs in memory precursor and short-lived effector P14 cell populations is reported as Z-scores for each shRNA in the library. Each bar represents a single shRNA. Negative control shRNAs are colored yellow. (B) Scatter plot shows the log2 ratio of normalized reads of all shRNAs in each sorted CD8+ T cell subset versus the input sample. Each dot represents a unique shRNA and is color-coded as in (A). (C) Tbx21 mRNA expression in shTbx21+ P14 CD8+ T cells , after 6 days of culture (10 U/mL IL-2). shCon = Control shRNAmir. (D) Intracellular IFN-γ staining in P14 CD8+ T cells, gated on shTbx21+ cells. Cells were cultured for 6 days (10 U/mL IL-2) and restimulated with PMA and Ionomycin for 4 hours before staining. (E) T-bet expression in shTbx21+ P14 CD8+ T cells from spleens at 8 days post LCMV infection (normalized geometric MFI). T-bet staining is shown for representative mice (right). (F) Contour plots show KLRG-1 and IL-7Rα staining on shTbx21+ P14 CD8+ T cells from representative mice at 8 days after LCMV infection. (G-I) Quantitation of CD8+ T cell subsets resulting from shTbx21+ P14 cells in vivo. (G) Shortlived effector cells (KLRG-1hi IL-7Rαlo). (H) Memory precursor cells (KLRG-1lo IL-7Rαhi). (I) Ratio of memory precursor to short-lived effector phenotype P14 cells, per mouse. (J) Prdm1 mRNA expression was determined by qRT-PCR in transduced P14 CD8+ T cells after sorting from spleens 7 days post LCMV infection. Blimp1 protein expression was determined by Western blot analysis after 4 days of culture with IL-12 (5ng/mL) and IL-2 (100 U/mL). (K) Map of Prdm1 with shRNA targeted regions indicated. (L) Contour plots of KLRG-1 and IL-7Rα staining on shPrdm1+ P14 CD8+ T cells from representative mice at 7 days after LCMV infection. (M) Ratios of memory precursor to effector P14 CD8+ T cells . Each symbol represents T cells from an individual mouse. Data are pooled from 3 (H, I) and 2 (J, L) independent experiments. *P<0.05, **P<0.01, ****P<0.0001. Error bars indicate standard deviations.
Figure 3. A pooled RNAi screen in…
Figure 3. A pooled RNAi screen in CD4 + T cells identifies potential regulators of…
Figure 3. A pooled RNAi screen in CD4+ T cells identifies potential regulators of Tfh and Th1 cell differentiation in vivo
(A) Scheme for the shRNAmir screening approach using SMARTA CD4+ T cells . (B) Relative enrichment of shRNAs in the Tfh or Th1 cell populations in vivo, reported as Z-score values for each shRNA in the library. Z-scores of |3| and |2| are indicated by a dotted line, and a tick, respectively. (C) Scatter plot shows the log2 of normalized reads of all shRNA in Tfh and Th1 cell populations vs. the input sample. This reveals effects on cell survival or proliferation. shRNA are color-coded as in (B). (D) Z-scores are shown for the shRNAs most depleted from the Tfh cell population in the Ion 318 Chip experiment. shBcl6 is highlighted in orange. (E) Z-scores of shRNAs depleted from Tfh in two independent deep sequencing reactions: Ion 314 Chip (black bars), Ion 318 Chip (red bars). The dotted line is a Z-score of −3. (F) SMARTA CD4+ T cells were transduced with the indicated shRNAs, transferred into B6 mice, and analyzed 6 days after LCMV infection. shCon = a control shRNAmir. Representative flow cytometry plots are shown of shRNA and shRNA+ SMARTA CD4+ T cells with Tfh cell (CXCR5+SLAMlo) gate drawn. (G) The differences in percentages of Tfh (%Tfh of Amt+ - %Tfh of Amt−) for each shRNAmir in SMARTA CD4+ T cells are shown. **P<0.01, ***P<0.001. Error bars indicate standard deviations.
Figure 4. Ccnt1 depletion promotes development of…
Figure 4. Ccnt1 depletion promotes development of Tfh cells during viral infection
( A )…
Figure 4. Ccnt1 depletion promotes development of Tfh cells during viral infection
(A) Comparison of shRNAmir screening results in both CD4 and CD8+ T cells. Tfh and Th1 CD4+ T cells differentiation results, plotted against memory precursor and effector CD8+ T cell differentiation results. Z-score values are shown. Common negative control shRNAs (yellow), and those targeting Ccnt1 are highlighted (red). (B) Table of top hits for genes required for memory precursor CD8+ T cell or Tfh CD4+ T cells differentiation (blue), and short-lived effector CD8+ T cell or Th1 CD4+ T cells differentiation (red). (C) Cyclin T1 protein expression in MCC T cells after transduction with the indicated shRNAs and 4 days of culture. The ratios of Cyclin T1 to TBP relative to the control shRNA are indicated. (D-E) Flow cytometry plots (D) and quantitation (normalized) (E) of Tfh cell differentiation (CXCR5+SLAMlo) by shCcnt1+ SMARTA CD4+ T cells at 6 days after LCMV infection. (F-G) Flow cytometry plots (F) and quantitation (normalized) (G) of GC Tfh cell differentiation (CXCR5+PSGL1lo) by shCcnt1+ SMARTA CD4+ T cells at 6 days after LCMV infection. (H-I) Flow cytometry plots (H) and quantitation (I) of CXCR5 and Bcl6 expression by shCcnt1+ SMARTA CD4+ T cells at 4 days after LCMV infection. (J) T-bet expression in shCcnt1+ SMARTA CD4+ T cells in vivo, 3 days after LCMV infection. T-bet geometric MFIs are graphed (right panel). (K) CD40L expression by shCcnt1+ SMARTA CD4+ T cells at 4 days after LCMV infection, after 2 hour restimulation with GP61–80 peptide. The percentages of CD40Lhi cells are indicated. Each symbol represents T cells from an individual mouse. Data are pooled from 3 (F, G) or representative of 2 (K) or 3 independent experiments (H-J). *P<0.05, **P<0.01, ***P<0.001, ****P<0.0001.
Figure 5. Cyclin T1 and Cdk9 depletion…
Figure 5. Cyclin T1 and Cdk9 depletion impairs Th1 cell differentiation in vitro and in…
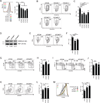
Figure 5. Cyclin T1 and Cdk9 depletion impairs Th1 cell differentiation in vitro and in vivo
(A-E) CD4+ T cells were transduced with Ccnt1 shRNAs and cultured under Th1-biasing conditions for 4 days before restimulation with PMA and ionomycin for 1 (D-E) or 4 hours (A-C). (A) T-bet expression by shCcnt1+ CD4+ T cells . Quantitation and an example histogram are shown. (B) Flow cytometry plots of IFN-γ expression by shCcnt1+ CD4+ T cells upon restimulation. (C) Quantitation of B, for all samples. (D) Cdk9 protein expression in shCdk9+ MCC T cells. (E) Flow cytometry plots of IFN-γ expression by shCdk9+ CD4+ T cells upon restimulation. (F) Quantitation of E, for all samples. (G-H) Flow cytometry plots (G) and quantitation (H) of Tfh cell differentiation (CXCR5+SLAMlo) by shCdk9+ SMARTA CD4+ T cells at 6 days after LCMV infection. (I-J) Flow cytometry plots (I) and quantitation (J) of GC Tfh differentiation (CXCR5+PSGL1lo) by shCdk9+ SMARTA CD4+ T cells at 6 days after LCMV infection. (K-L) Flow cytometry plots (K) and quantitation (L) of CXCR5 and Bcl6 expression by shCdk9+ SMARTA CD4+ T cells, 4 days after LCMV infection. (M) Histograms of CD40L expression on shCdk9+ SMARTA CD4+ T cells , after isolation from spleens 4 days after LCMV infection and restimulation with GP61-80 peptide for 4 hours. The percentages of CD40Lhi SMARTA are shown, and summarized (right). Data are representative of 2 independent experiments. *P<0.05, **P<0.01, ***P<0.001, ****P<0.0001.
Figure 6. Cyclin T1 and Cdk9 depletion…
Figure 6. Cyclin T1 and Cdk9 depletion impairs generation of effector CD8 + T cells…
Figure 6. Cyclin T1 and Cdk9 depletion impairs generation of effector CD8+ T cells during LCMV infection
(A) Western blot analysis of Cyclin T1 in FACS-sorted shCcnt1+ P14 CD8+ T cells . Cells were cultured 6 days in low IL-2 (10 U/ml). (B) Expansion of FACS-sorted shCcnt1+ P14 CD8 T in culture. Low IL-2 (10 U/ml), high IL-2 (100 U/ml). (C-L) Adoptively transferred P14 CD8+ T cells transduced with the indicated shRNAs were analyzed on day 7 (C-G) or day 8 (H-L) after LCMV infection. (C) The numbers and percentages of shCcnt1+ P14 cells in the spleen. (D) Contour plots show KLRG-1 and IL-7Rα staining on shCcnt1+ P14 CD8+ T cells from representative mice at 8 days after LCMV infection. (E-G) Quantitation of CD8+ T cell subsets from shCcnt1+ P14 cells in vivo. (E) Short-lived effector cells (KLRG-1hi IL-7Rαlo). (F) Memory precursor cells (KLRG-1lo IL-7Rαhi). (G) Ratio of memory precursor to short-lived effector phenotype P14 cells, per mouse. (H) Contour plots show KLRG-1 and IL-7Rα staining by shCdk9+ P14 CD8+ T cells from representative mice at 8 days after LCMV infection. (I-L) Quantitation of CD8+ T cell subsets from shCdk9+ P14 cells in vivo. (I) Short-lived effector cells (KLRG-1hi IL-7Rαlo). (J) Memory precursor cells (KLRG-1lo IL-7Rαhi). (K) Ratio of memory precursor to short-lived effector phenotype P14 cells, per mouse. (L) Summarized T-bet expression based on intracellular staining and flow cytometry. Each symbol represents T cells from separate mice. Data are pooled from 2 independent experiments. *P<0.05, **P<0.01, ***P<0.001, ****P<0.0001. Error bars indicate standard deviations.
Figure 7. Cyclin T1 and Cdk9 are…
Figure 7. Cyclin T1 and Cdk9 are required for antiviral CTL functions
( A )…
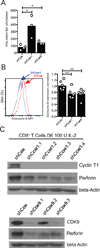
Figure 7. Cyclin T1 and Cdk9 are required for antiviral CTL functions
(A) LCMV titers the in spleen were determined 8 days after LCMV infection. (B) Granzyme B expression in P14 cells at day 8 post-infection. Histogram (left) and quantitation (geometric MFI; right). (C) Western blot analysis of Cyclin T1, Cdk9, Perforin and p-actin expression in whole cell lysates from flow cytometry-sorted shCcnt1+ and shCdk9+ P14 CD8+ T cells after 6 days in culture (100 U/ml).
Araki K, Turner AP, Shaffer VO, Gangappa S, Keller SA, Bachmann MF, Larsen CP, Ahmed R. mTOR regulates memory CD8 T-cell differentiation. Nature. 2009;460:108–112.
-
PMC
-
PubMed
Badovinac VP, Haring JS, Harty JT. Initial T cell receptor transgenic cell precursor frequency dictates critical aspects of the CD8(+) T cell response to infection. Immunity. 2007;26:827–841.
-
PMC
-
PubMed
Beronja S, Janki P, Heller E, Lien WH, Keyes BE, Oshimori N, Fuchs E. RNAi screens in mice identify physiological regulators of oncogenic growth. Nature. 2013;501:185–190.
-
PMC
-
PubMed
Best JA, Blair DA, Knell J, Yang E, Mayya V, Doedens A, Dustin ML, Goldrath AW, Monach P, Shinton SA, et al. Transcriptional insights into the CD8(+) T cell response to infection and memory T cell formation. Nat Immunol. 2013;14:404–412.
-
PMC
-
PubMed
Blazek D, Kohoutek J, Bartholomeeusen K, Johansen E, Hulinkova P, Luo Z, Cimermancic P, Ule J, Peterlin BM. The Cyclin K/Cdk12 complex maintains genomic stability via regulation of expression of DNA damage response genes. Genes Dev. 2011;25:2158–2172.
-
PMC
-
PubMed