

WMAXC: a weighted maximum clique method for identifying condition-specific sub-network
- PMID: 25148538
- PMCID: PMC4141761
- DOI: 10.1371/journal.pone.0104993
WMAXC: a weighted maximum clique method for identifying condition-specific sub-network
Abstract
Sub-networks can expose complex patterns in an entire bio-molecular network by extracting interactions that depend on temporal or condition-specific contexts. When genes interact with each other during cellular processes, they may form differential co-expression patterns with other genes across different cell states. The identification of condition-specific sub-networks is of great importance in investigating how a living cell adapts to environmental changes. In this work, we propose the weighted MAXimum clique (WMAXC) method to identify a condition-specific sub-network. WMAXC first proposes scoring functions that jointly measure condition-specific changes to both individual genes and gene-gene co-expressions. It then employs a weaker formula of a general maximum clique problem and relates the maximum scored clique of a weighted graph to the optimization of a quadratic objective function under sparsity constraints. We combine a continuous genetic algorithm and a projection procedure to obtain a single optimal sub-network that maximizes the objective function (scoring function) over the standard simplex (sparsity constraints). We applied the WMAXC method to both simulated data and real data sets of ovarian and prostate cancer. Compared with previous methods, WMAXC selected a large fraction of cancer-related genes, which were enriched in cancer-related pathways. The results demonstrated that our method efficiently captured a subset of genes relevant under the investigated condition.
Conflict of interest statement
Figures
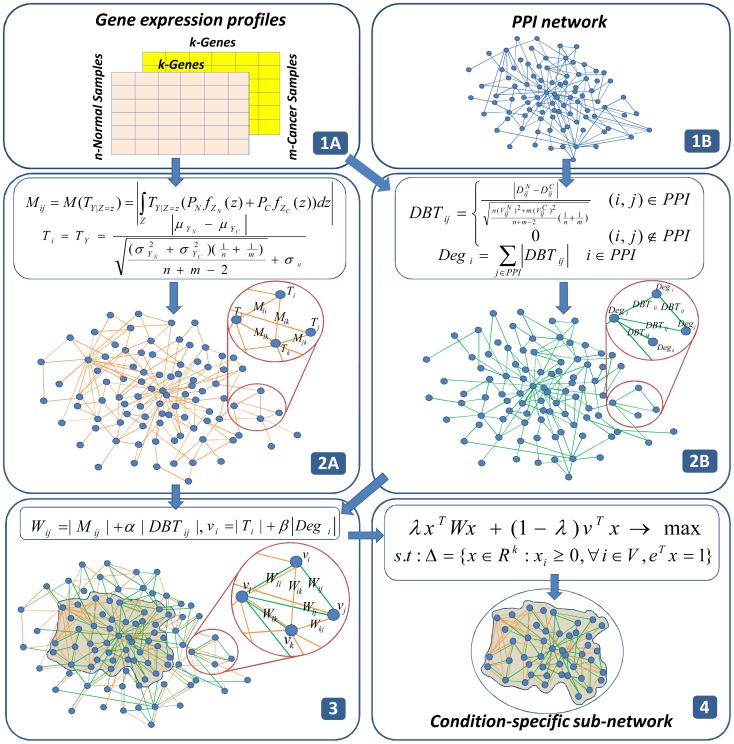
 is used to measure activity of gene
  (a node score) and for each pair of genes
  is used to measure connectivity relationship between gene
  and gene
  (an edge score). In (2B), for each interaction in PPI network,
  is used to measure activity of interaction behavior between gene
  and gene
  (an edge contribution score from PPI) and for each gene,
  is used to measure the weighted degree of gene
  (a node contribution score from PPI) under the condition. (3) We then combine the two responsive networks to construct the background network by assigning node and edge scores to a set of genes. Orange edges represent gene-gene co-expression estimated from only gene expression data and green edges represent activity of interactions in the PPI network. In the process of combining two networks, new edges are included to (2A) although they are not in the existing PPI network. (4) Finally, we solve the constrained optimization problem to obtain the single optimal sub-network.
References
Publication types
MeSH terms
LinkOut - more resources
Full Text Sources
Other Literature Sources
Molecular Biology Databases
