

Predictions of heading date in bread wheat (Triticum aestivum L.) using QTL-based parameters of an ecophysiological model
- PMID: 25148833
- PMCID: PMC4203124
- DOI: 10.1093/jxb/eru328
Predictions of heading date in bread wheat (Triticum aestivum L.) using QTL-based parameters of an ecophysiological model
Abstract
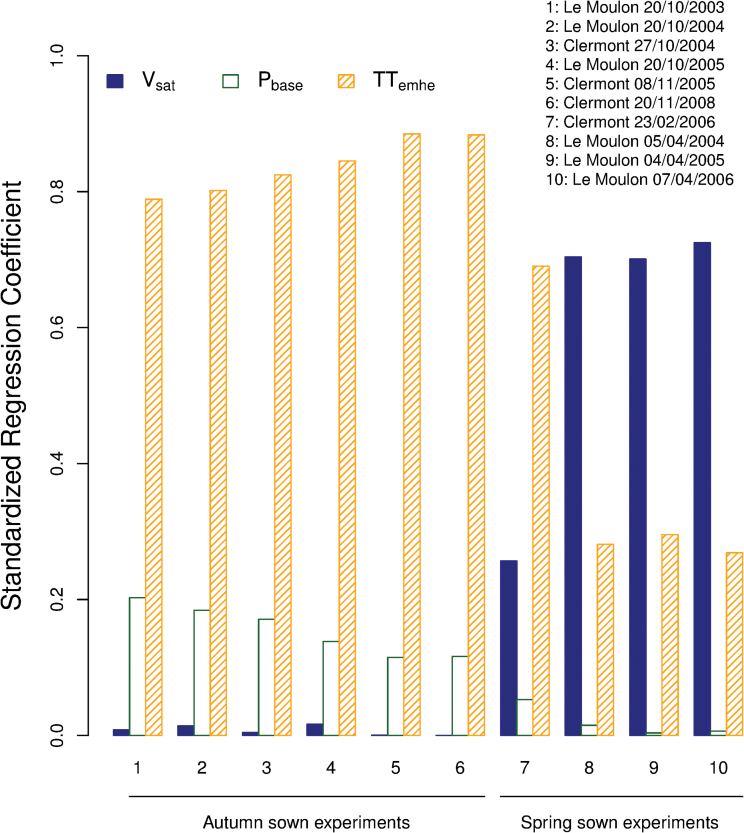
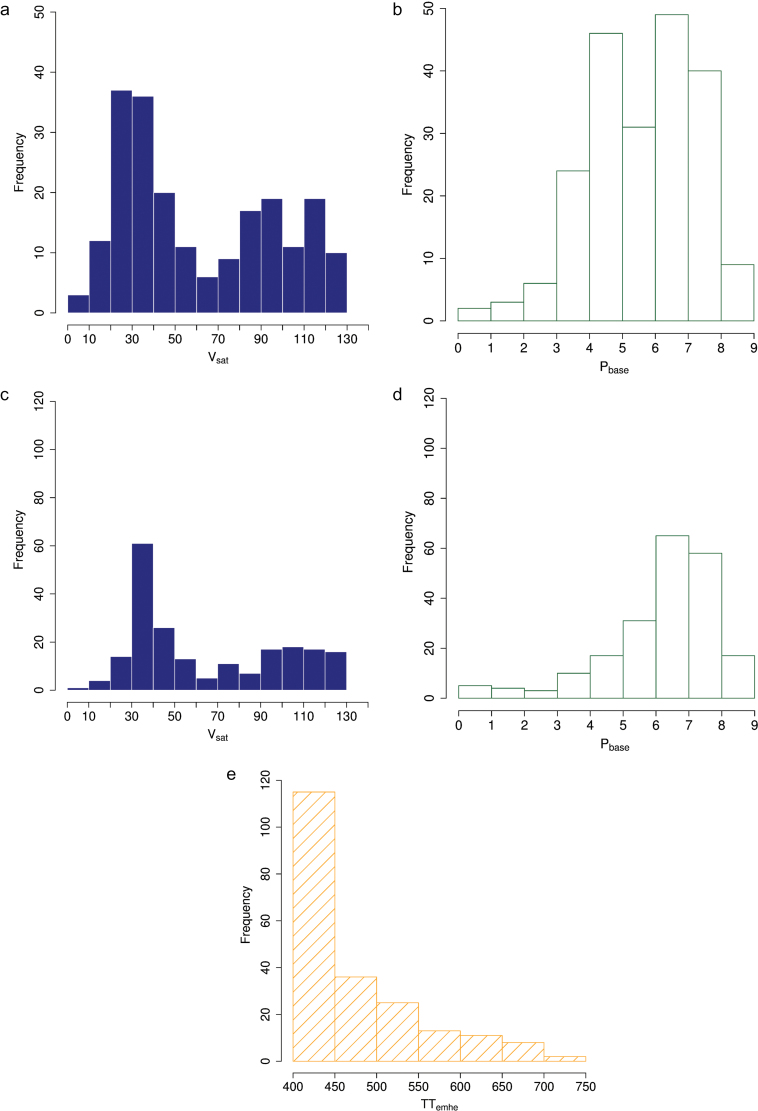
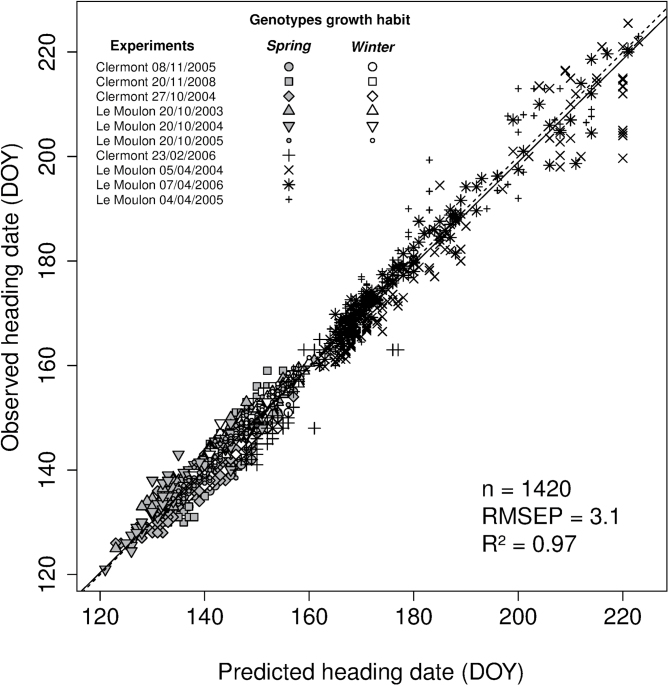
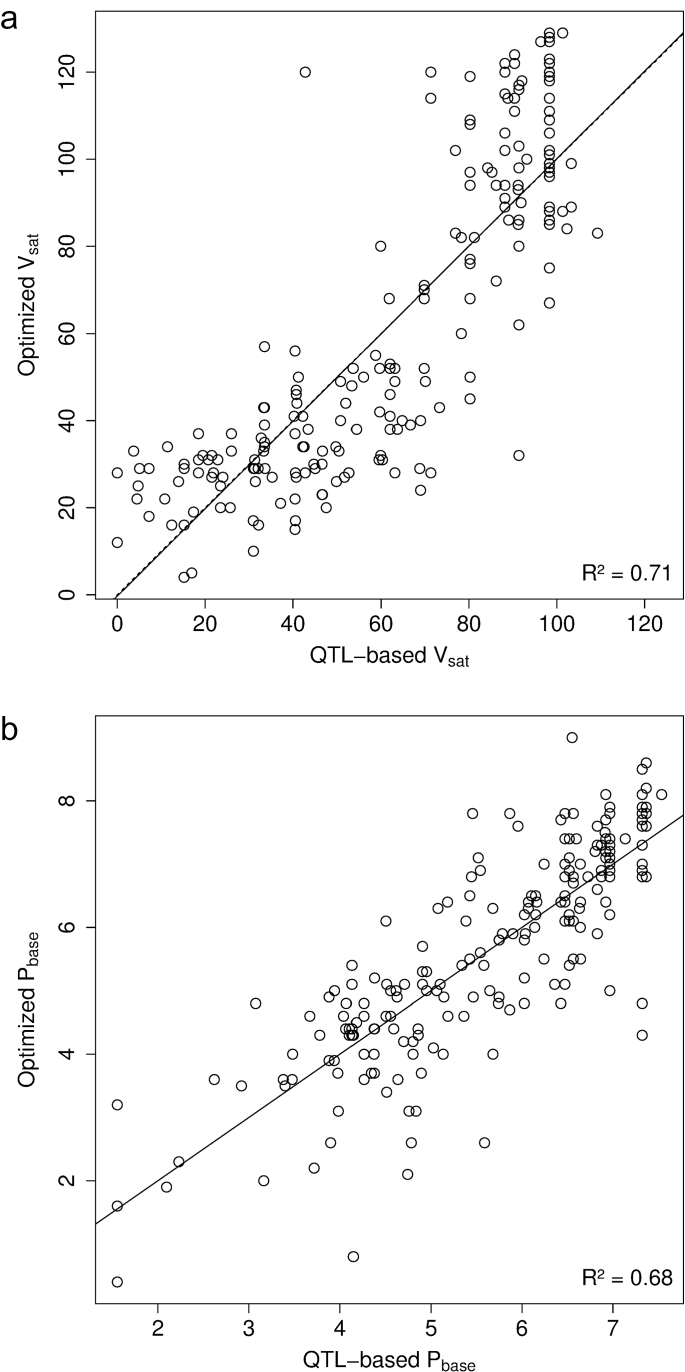
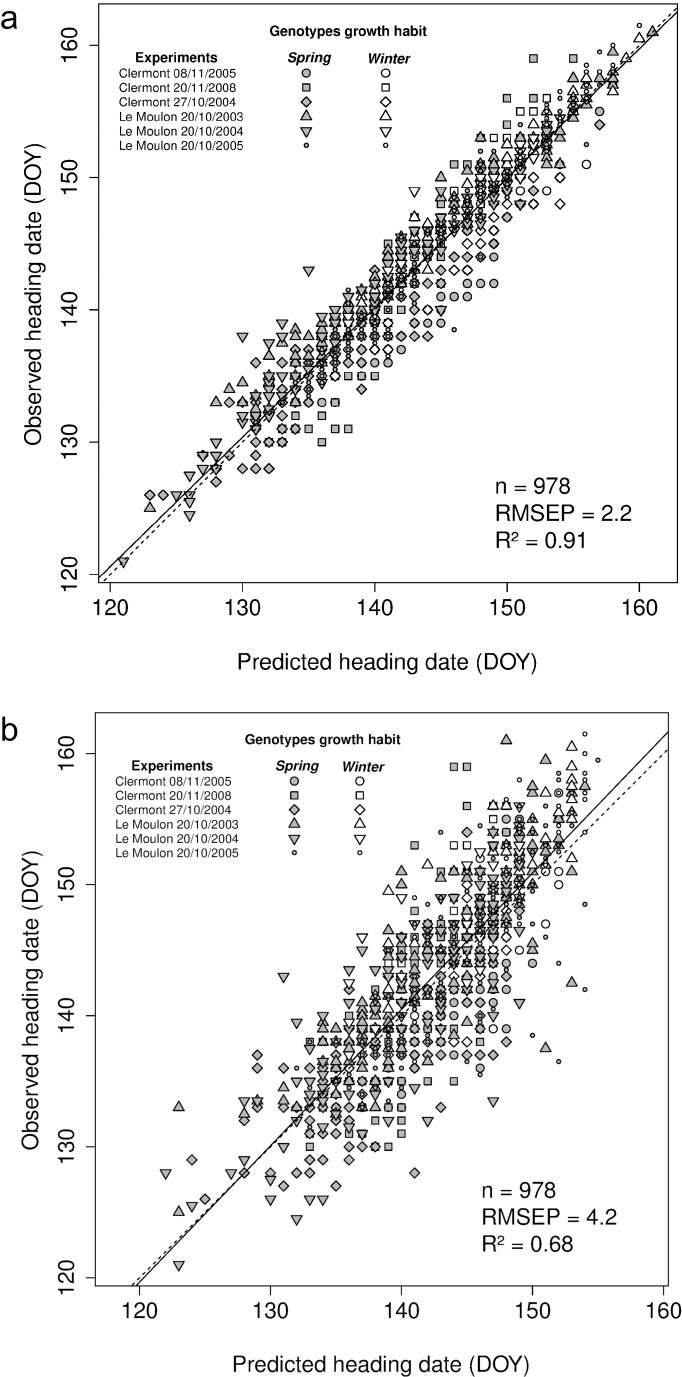
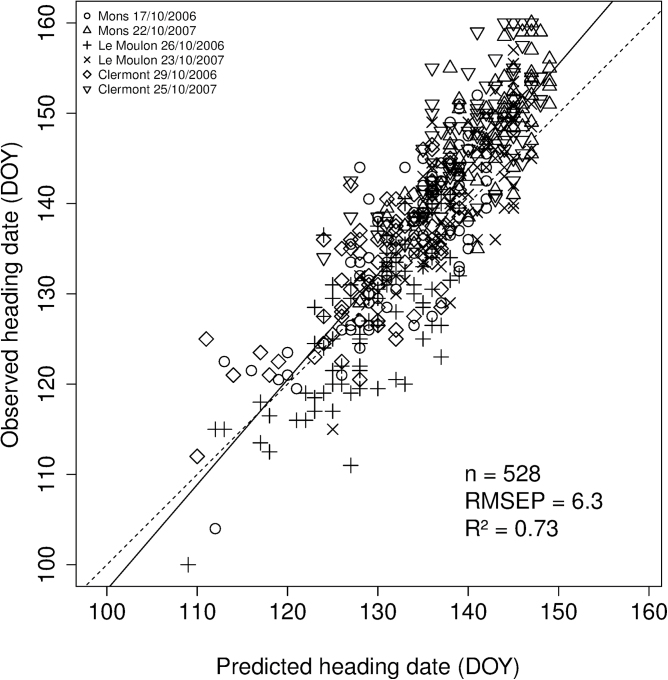
Prediction of wheat phenology facilitates the selection of cultivars with specific adaptations to a particular environment. However, while QTL analysis for heading date can identify major genes controlling phenology, the results are limited to the environments and genotypes tested. Moreover, while ecophysiological models allow accurate predictions in new environments, they may require substantial phenotypic data to parameterize each genotype. Also, the model parameters are rarely related to all underlying genes, and all the possible allelic combinations that could be obtained by breeding cannot be tested with models. In this study, a QTL-based model is proposed to predict heading date in bread wheat (Triticum aestivum L.). Two parameters of an ecophysiological model (V sat and P base , representing genotype vernalization requirements and photoperiod sensitivity, respectively) were optimized for 210 genotypes grown in 10 contrasting location × sowing date combinations. Multiple linear regression models predicting V sat and P base with 11 and 12 associated genetic markers accounted for 71 and 68% of the variance of these parameters, respectively. QTL-based V sat and P base estimates were able to predict heading date of an independent validation data set (88 genotypes in six location × sowing date combinations) with a root mean square error of prediction of 5 to 8.6 days, explaining 48 to 63% of the variation for heading date. The QTL-based model proposed in this study may be used for agronomic purposes and to assist breeders in suggesting locally adapted ideotypes for wheat phenology.
Keywords: Association genetics; ecophysiological model; gene-based modelling; heading date; phenology; wheat..
© The Author 2014. Published by Oxford University Press on behalf of the Society for Experimental Biology.
Figures
References
-
- Asseng S, Keating B, Fillery IR, Gregory P, Bowden J, Turner N, Palta J, Abrecht D. 1998. Performance of the APSIM-wheat model in Western Australia. Field Crops Research 57, 163–179
-
- Balfourier F, Roussel V, Strelchenko P, Exbrayat-Vinson F, Sourdille P, Boutet G, Koenig J, Ravel C, Mitrofanova O, Beckert M. 2007. A worldwide bread wheat core collection arrayed in a 384-well plate. Theoretical and Applied Genetics 114, 1265–1275 - PubMed
-
- Beales J, Turner A, Griffiths S, Snape JW, Laurie DA. 2007. A pseudo-response regulator is misexpressed in the photoperiod insensitive Ppd-D1a mutant of wheat (Triticum aestivum L.). Theoretical and Applied Genetics 115, 721–733 - PubMed
-
- Bentley AR, Turner AS, Gosman N, Leigh FJ, Maccaferri M, Dreisigacker S, Greenland A, Laurie DA. 2010. Frequency of photoperiod-insensitive Ppd-A1a alleles in tetraploid, hexaploid and synthetic hexaploid wheat germplasm. Plant Breeding 130, 10–15
-
- Bertin N, Martre P, Génard M, Quilot B, Salon C. 2010. Under what circumstances can process-based simulation models link genotype to phenotype for complex traits? Case-study of fruit and grain quality traits. Journal of Experimental Botany 61, 955–967 - PubMed
Publication types
MeSH terms
LinkOut - more resources
Full Text Sources
Other Literature Sources
Research Materials
