. 2014 Aug 23:11:148.
doi: 10.1186/s12974-014-0148-9.

Expression of 2',3'-cyclic nucleotide 3'-phosphodiesterase (CNPase) and its roles in activated microglia in vivo and in vitro

Affiliations

Expression of 2',3'-cyclic nucleotide 3'-phosphodiesterase (CNPase) and its roles in activated microglia in vivo and in vitro

Lijuan Yang et al. J Neuroinflammation. .

Abstract

Background: We reported previously that amoeboid microglial cells in the postnatal rat brain expressed 2',3'-cyclic nucleotide 3'-phosphodiesterase (CNPase) both in vivo and in vitro; however, the functional role of CNPase in microglia has remained uncertain. This study extended the investigation to determine CNPase expression in activated microglia derived from cell culture and animal models of brain injury with the objective to clarify its putative functions.

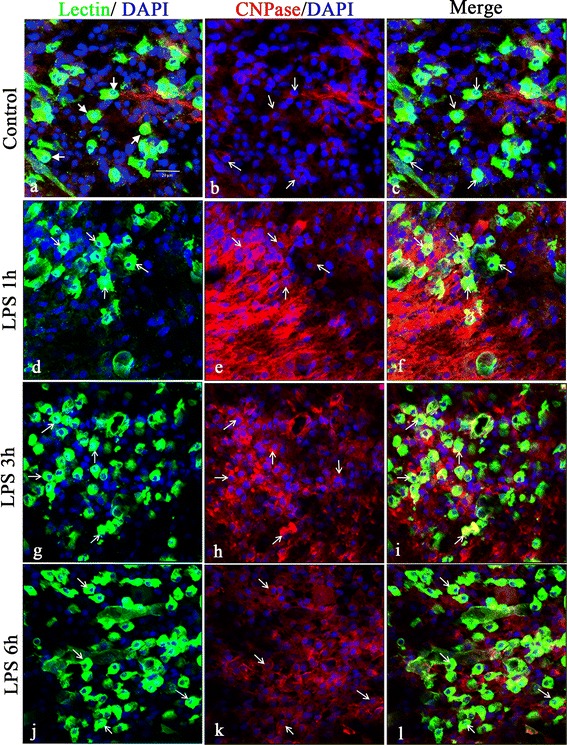
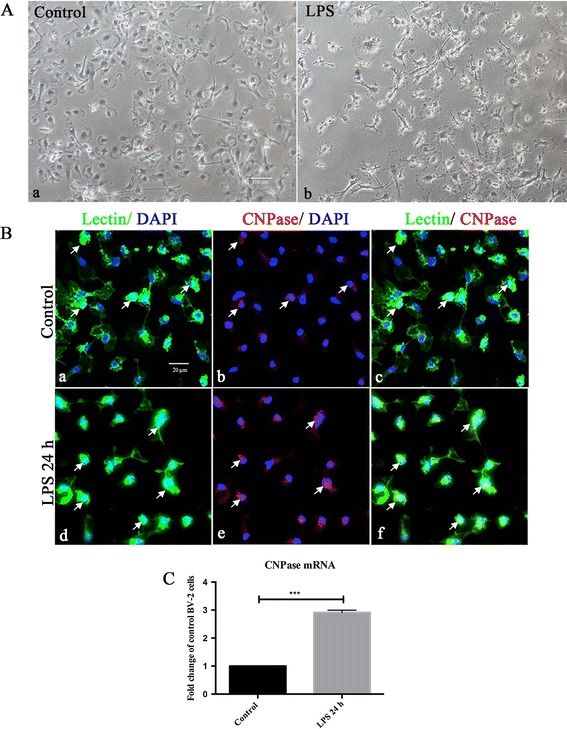
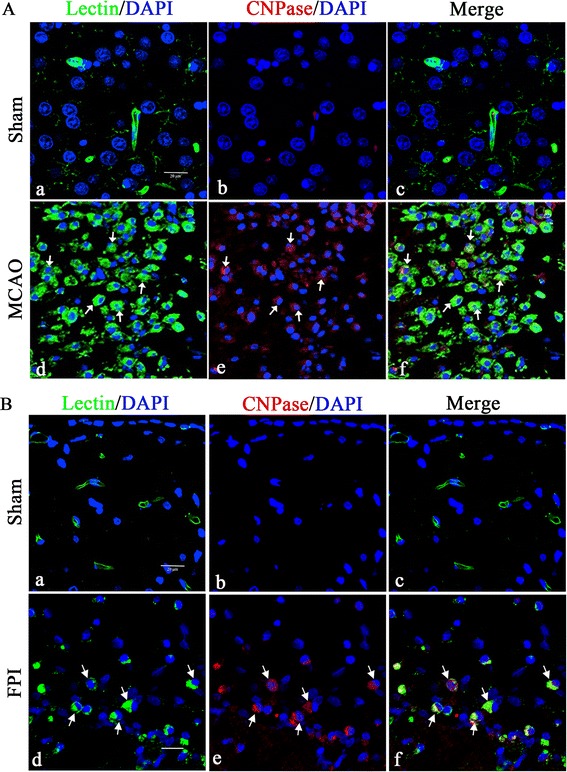
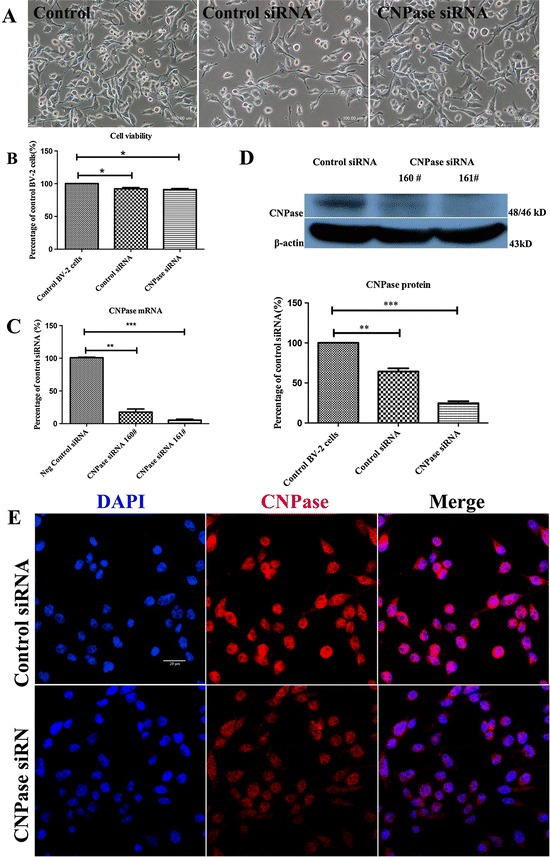
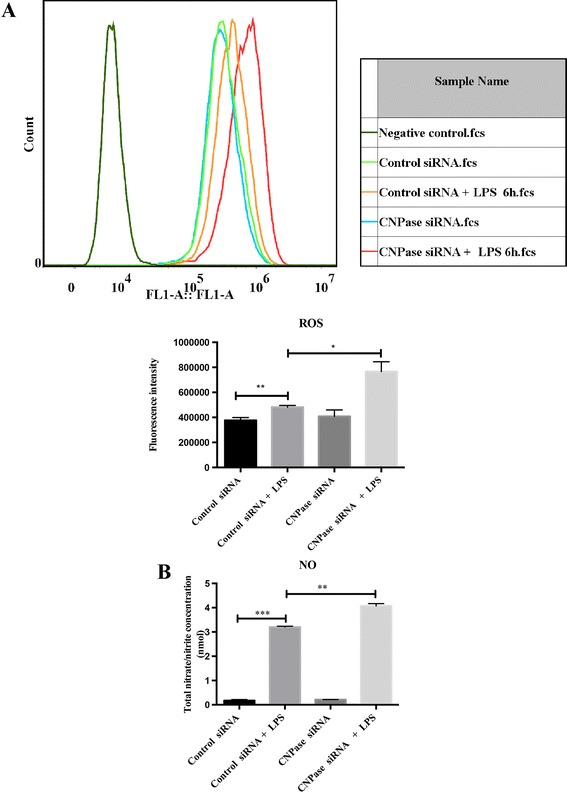
Methods: Three-day-old Wistar rats were given an intraperitoneal injection of lipopolysaccharide to induce microglial activation, and the rats were killed at different time points. Along with this, primary cultured microglial cells were subjected to lipopolysaccharide treatment, and expression of CNPase was analyzed by real-time reverse transcription PCR and immunofluorescence. Additionally, siRNA transfection was employed to downregulate CNPase in BV-2 cells. Following this, inducible nitric oxide synthase, IL-1β and TNF-α were determined at mRNA and protein levels. Reactive oxygen species and nitric oxide were also assessed by flow cytometry and colorimetric assay, respectively. In parallel to this, CNPase expression in activated microglia was also investigated in adult rats subjected to fluid percussion injury as well as middle cerebral artery occlusion.

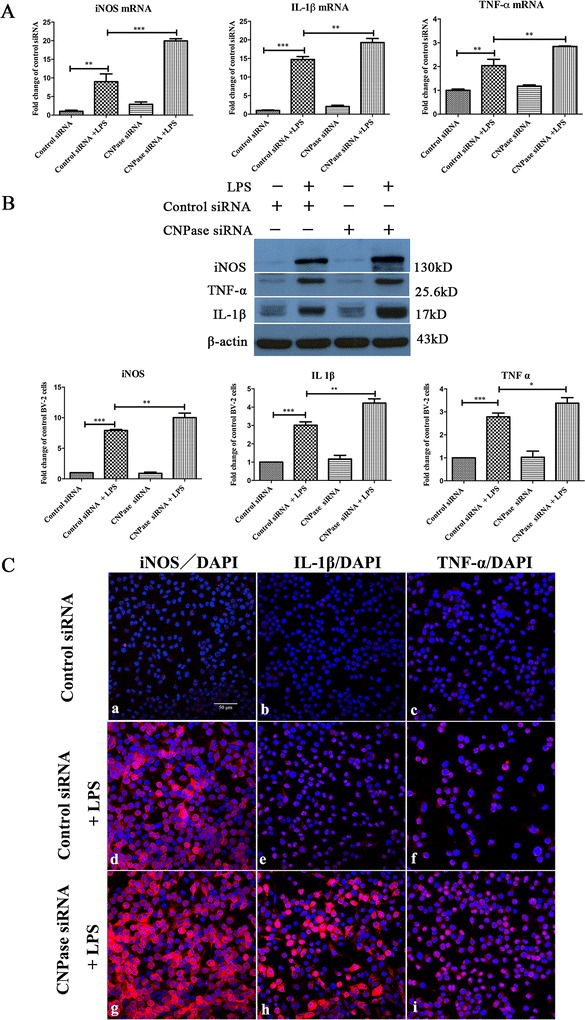
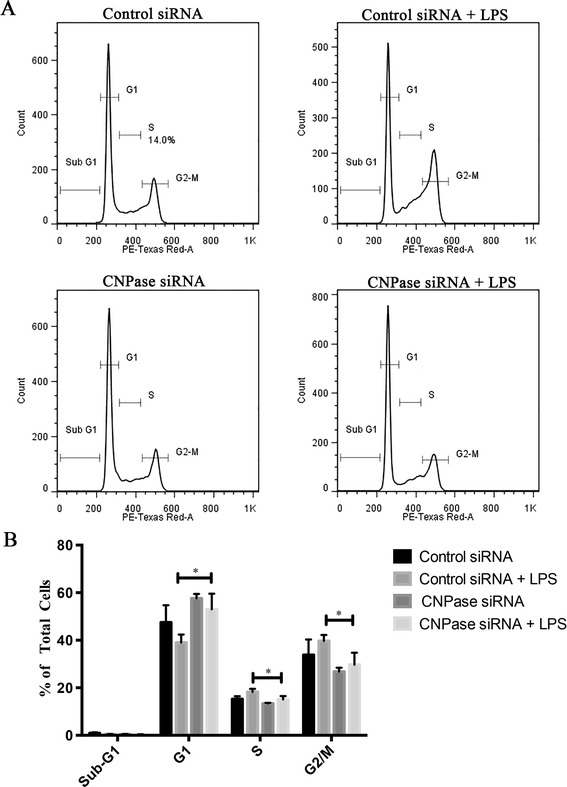
Results: In vivo, CNPase immunofluorescence in activated microglia was markedly enhanced after lipopolysaccharide treatment. A similar feature was observed in the rat brain after fluid percussion injury and middle cerebral artery occlusion. In vitro, CNPase protein and mRNA expression was increased in primary microglia with lipopolysaccharide stimulation. Remarkably, inducible nitric oxide synthase, IL-1β, TNF-α, reactive oxygen species and nitric oxide were significantly upregulated in activated BV-2 cells with CNPase knockdown. siRNA knockdown of CNPase increased microglia migration; on the other hand, microglial cells appeared to be arrested at G1 phase.

Conclusions: The present results have provided the first morphological and molecular evidence that CNPase expression is increased in activated microglia. CNPase knockdown resulted in increased expression of various inflammatory mediators. It is concluded that CNPase may play an important role as a putative anti-inflammatory gene both in normal and injured brain.


Figures

Figure 1
Figure 1
CNPase immunofluorescence was increased in the brain in postnatal rats following lipopolysaccharide injection. Confocal images showing the distribution of lectin (green), CNPase (red) and DAPI (blue) immunoreactive cells in the postnatal rat brain at 1 (d-f), 3 (g-i) and 6 hours (j-l) after lipopolysaccharide (LPS) treatment and the corresponding control (a-c). Colocalized expression of CNPase in lectin immunoreactive cells (arrows in c, f, i, l) can be seen. Note the upregulated expression of CNPase in some lectin-positive microglial cells after LPS treatment (f, i, l,). Arrows indicate microglial cells expressing both lectin and CNPase. Scale bar= = 20 μm (A). CNPase, 2′,3′-cyclic nucleotide 3′-phosphodiesterase; DAPI, 4′,6- diamidino-2-phenylindole.
Figure 2
Figure 2
CNPase expression was increased in primary cultured microglia following lipopolysaccharide treatment. (A) Note the change in external morphology of primary microglial cells bearing long extending and stout processes after lipopolysaccharide (LPS) treatment (Ab) in comparison with the control (Aa) under the phase contrast microscope. (B) Confocal images showing CNPase expression (Bb, Be; red) in primary microglia labeled with lectin (Ba, Bd; green) and DAPI (blue) in both control and LPS treatment for 24 hours. CNPase immunofluorescence intensity is enhanced after LPS treatment (Bf) in comparison with the control (Bc). (C) CNPase mRNA expression in control and LPS activated primary microglia. LPS stimulated primary microglial cells show a significant upregulation of CNPase mRNA in comparison with the control cells. ***P < 0.001. The values represent the mean ± SD in triplicate. Scale bars = 100 μm (A) and 20 μm (B). CNPase, 2′,3′-cyclic nucleotide 3′-phosphodiesterase; DAPI, 4′,6- diamidino-2-phenylindole.
Figure 3
Figure 3
Confocal images showing the induction of CNPase expression at 7 days after middle cerebral artery occlusion and fluid perfusion injury. CNPase expression (Ab, Ae, and Bb, Be; red) in FITC-lectin labeled microglia (Aa, Ad, and Ba, Bd; green,) and DAPI (blue) in the ischemic cortex (A) and ipsilateral injury cerebrum (B) is hardly detected in the microglia in the sham group. A marked increase in CNPase expression is observed in FITC-lectin-labeled microglia both in the middle cerebral artery occlusion (MCAO) infarct area and fluid perfusion injury (FPI) site when compared to the sham group. Note also that the activated microglial cells are amoeboidic in appearance. Scale bars = 20 μm (A and B). CNPase, 2′,3′-cyclic nucleotide 3′-phosphodiesterase; DAPI, 4′,6- diamidino-2-phenylindole.
Figure 4
Figure 4
Downregulation of CNPase after CNPase siRNA transfection in BV-2 cells. (A) There was no noticeable change in external morphology in BV-2 cells when transfected with either control small interfering RNA (siRNA) or CNPase siRNA, and when compared with the non-transfected control cells under the phase-contrast microscope. (B) The viability of BV-2 cells transfected with control siRNA and CNPase siRNA is 92% and 91%, respectively, against the non-transfected control value. (C) Reverse transcription polymerase chain reaction analysis shows that the efficiency of siRNA (160 #)-mediated suppression of CNPase is about 84% while that of siRNA (161 #) is about 94% compared to negative control (normalized with β-actin). (D) The upper panel shows the specific Western band of CNPase and β-actin proteins. The lower panel shows bar graphs depicting significant changes in the optical density of different groups. Note the remaining CNPase protein expression in CNPase siRNA (161 #) transfected BV-2 cells is about 25% compared to the control siRNA transfected BV-2 cells. (E) Immunofluorescence images show CNPase immunoreactivity is markedly reduced in CNPase siRNA transfected BV-2 cells compared to negative control. *P < 0.05, **P < 0.01 and ***P < 0.001. The values represent the mean ± SD in triplicate. Scale bars = 100 μm (A) and 20 μm (E). CNPase, 2′,3′-cyclic nucleotide 3′-phosphodiesterase; DAPI, 4′,6- diamidino-2-phenylindole.
Figure 5
Figure 5
CNPase knockdown increased inducible nitric oxide synthesis, IL-1β and TNF-α expression induced by lipopolysaccharide in BV-2 cells. (A) Reverse transcription polymerase chain reaction analysis of iNOS, IL-1β and TNF-α gene expression in BV-2 cells transfected with control small interfering RNA (siRNA), transfected with control siRNA + lipopolysaccharide (LPS), and transfected with CNPase siRNA and CNPase siRNA + LPS. Note that iNOS, IL-1β and TNF-α mRNA expression is increased by different amounts, respectively, after LPS treatment in control siRNA transfected BV-2 (normalized with β-actin), but the increase was significantly higher in LPS stimulated CNPase siRNA transfected BV-2 cells compared with control siRNA transfected BV-2 cells exposed to LPS stimulation. (B) iNOS, IL-1β and TNF-α protein expression in different groups of BV-2 cells given LPS treatments. The upper panel shows specific bands of iNOS, IL-1β ,TNF-α and β-actin. The lower panel of the bar graphs shows significant changes in the optical density following LPS treatment (given as fold-change of control siRNA transfected group). iNOS, IL-1β and TNF-α protein expression is significantly increased after LPS treatment in control siRNA transfected BV-2 cells and the increase is further augmented after LPS stimulation in CNPase transfected groups. (C) Immunofluorescence images show iNOS, IL-1β and TNF-α immunoreactivity is markedly increased in CNPase siRNA transfected BV-2 cells subjected to LPS treatment compared to cells transfected with control siRNA followed by LPS treatment. *P < 0.05 and **P < 0.01. The values represent the mean ± SD in triplicate. Scale bar = 50 μm (C) . CNPase, 2′,3′-cyclic nucleotide 3′-phosphodiesterase; IL-1β, interleukin-1 beta; iNOS, inducible nitric oxide synthase; TNF, tumor necrosis factor alpha.
Figure 6
Figure 6
CNPase knock down increased the production of reactive oxygen species and nitric oxide induced by lipopolysaccharide stimulation in BV-2 cells. (A) Intracellular reactive oxygen species (ROS) and production of nitric oxide (NO) in BV-2 cells transfected with control small interfering RNA (siRNA), control siRNA + lipopolysaccharide (LPS) 6 hours, and transfected with CNPase siRNA and CNPase siRNA + LPS 6 hours. (A) The upper panel shows cell counts (y-axis) and log10 expression of fluorescence intensity (x-axis). The lower panel is a bar graph showing a significant change in the fluorescence intensity of intracellular ROS production following the various treatments. Note that the increase of ROS production in CNPase siRNA transfected BV-2 cells with LPS treatment is higher than that in control siRNA transfected BV-2 cells with LPS stimulation. (B) NO production in supernatant shows a similar change as with ROS in the different groups mentioned above. *P < 0.05, **P < 0.01 and ***P < 0.001. The values represent the mean ± SD in triplicate. CNPase, 2′,3′-cyclic nucleotide 3′-phosphodiesterase; fcs, fluorescence-activated cell sorting.
Figure 7
Figure 7
CNPase knockdown on cell cycle progression in BV-2 cells. (A) Representative DNA histogram plots from an individual experiment showing control small interfering RNA (siRNA) and CNPase siRNA transfected groups with and without lipopolysaccharide (LPS) treatment. (B) Percentage of total cells in each phase of cell cycle. CNPase knockdown arrested the cells in the G1 phase with a corresponding decrease in the percentage of cells entering into the S + G2/M phase. *P < 0.05 compared with controls by unpaired t-test, from three independent experiments. CNPase, 2′,3′-cyclic nucleotide 3′-phosphodiesterase.
Figure 8
Figure 8
CNPase knockdown does not affect the nuclear translocation of NF-κB in activated BV-2 microglial cells. (A) Western blot shows the expression of NF-κB (65 kDa) and Lamin A (74 kDa) in nuclear protein isolated from the various groups. (B) Expression of nuclear NF-κB protein was significantly increased in BV-2 cells exposed to lipopolysaccharide (LPS) for 3 hours, and this increase has no significance between control small interfering RNA (siRNA) and CNPase siRNA tranfected BV-2 cells. Data are presented as mean ± SD (n = 3), ***P < 0.001; ns, no significant difference. CNPase, 2′,3′-cyclic nucleotide 3′-phosphodiesterase.

Similar articles

Cited by

References

    1. Muller HW, Clapshaw PA, Seifert W. Two molecular forms of the isolated brain enzyme 2′,3′-cyclic nucleotide 3′-phosphodiesterase. FEBS Lett. 1981;131:37–40. doi: 10.1016/0014-5793(81)80882-4. - DOI - PubMed
    1. Monoh K, Kurihara T, Sakimura K, Takahashi Y. Structure of mouse 2′,3′-cyclic-nucleotide 3′-phosphodiesterase gene. Biochem Biophys Res Commun. 1989;165:1213–1220. doi: 10.1016/0006-291X(89)92731-9. - DOI - PubMed
    1. O’Neill RC, Minuk J, Cox ME, Braun PE, Gravel M. CNP2 mRNA directs synthesis of both CNP1 and CNP2 polypeptides. J Neurosci Res. 1997;50:248–257. doi: 10.1002/(SICI)1097-4547(19971015)50:2<248::AID-JNR13>3.0.CO;2-4. - DOI - PubMed
    1. Gravel M, DeAngelis D, Braun PE. Molecular cloning and characterization of rat brain 2′,3′-cyclic nucleotide 3′-phosphodiesterase isoform 2. J Neurosci Res. 1994;38:243–247. doi: 10.1002/jnr.490380302. - DOI - PubMed
    1. Kurihara T, Monoh K, Sakimura K, Takahashi Y. Alternative splicing of mouse brain 2′,3′-cyclic-nucleotide 3′-phosphodiesterase mRNA. Biochem Biophys Res Commun. 1990;170:1074–1081. doi: 10.1016/0006-291X(90)90502-E. - DOI - PubMed

Publication types

MeSH terms

Substances

LinkOut - more resources