. 2014 Nov;24(11):1830-41.
doi: 10.1101/gr.176792.114. Epub 2014 Aug 22.

Preservation of genetic and regulatory robustness in ancient gene duplicates of Saccharomyces cerevisiae

Affiliations

Preservation of genetic and regulatory robustness in ancient gene duplicates of Saccharomyces cerevisiae

Orla M Keane et al. Genome Res. 2014 Nov.

Abstract

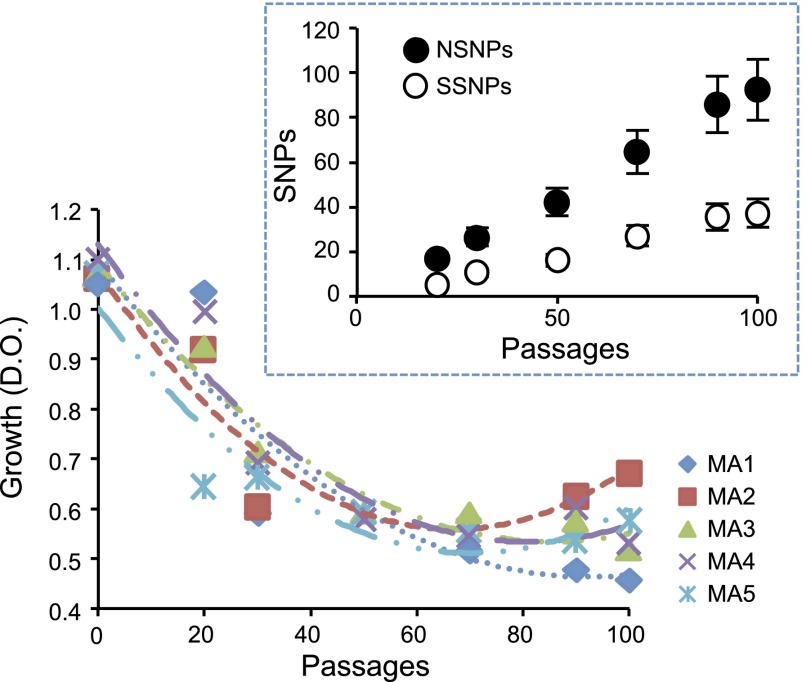
Biological systems remain robust against certain genetic and environmental challenges. Robustness allows the exploration of ecological adaptations. It is unclear what factors contribute to increasing robustness. Gene duplication has been considered to increase genetic robustness through functional redundancy, accelerating the evolution of novel functions. However, recent findings have questioned the link between duplication and robustness. In particular, it remains elusive whether ancient duplicates still bear potential for innovation through preserved redundancy and robustness. Here we have investigated this question by evolving the yeast Saccharomyces cerevisiae for 2200 generations under conditions allowing the accumulation of deleterious mutations, and we put mechanisms of mutational robustness to a test. S. cerevisiae declined in fitness along the evolution experiment, but this decline decelerated in later passages, suggesting functional compensation of mutated genes. We resequenced 28 genomes from experimentally evolved S. cerevisiae lines and found more mutations in duplicates--mainly small-scale duplicates--than in singletons. Genetically interacting duplicates evolved similarly and fixed more amino acid-replacing mutations than expected. Regulatory robustness of the duplicates was supported by a larger enrichment for mutations at the promoters of duplicates than at those of singletons. Analyses of yeast gene expression conditions showed a larger variation in the duplicates' expression than that of singletons under a range of stress conditions, sparking the idea that regulatory robustness allowed a wider range of phenotypic responses to environmental stresses, hence faster adaptations. Our data support the persistence of genetic and regulatory robustness in ancient duplicates and its role in adaptations to stresses.


Figures

Figure 1.
Figure 1.
The evolution experiment of the Saccharomyces cerevisiae haploid Δmsh2 strain. We started five independent evolution experiments from a single ancestral colony. Every 48 h, we randomly picked one colony and transferred it to another plate. The experiment involved 100 passages, corresponding to roughly 2200 generations (G) of S. cerevisiae. Single colonies were isolated for genome sequencing at passages 20, 30, 50, 70, 90, and 100, and growth was assayed at those time points of the experiment. Every 10 passages, a single colony was frozen at −80°C, obtaining a yeast fossil record.
Figure 2.
Figure 2.
Genome-wide distribution of single nucleotide polymorphisms (SNPs) along the experimental evolution of Saccharomyces cerevisiae in singletons (blue vertical lines) and duplicates (red vertical lines). (A) Distribution of nonsynonymous SNPs (NSNPs) in protein coding regions of singletons and duplicates in the 16 S. cerevisiae chromosomes (chromosomes I to XVI). (B) Distribution of SNPs in the promoter regions of singletons and duplicates. Yellow circles refer to the chromosomal centromere. We also represent mutations in mitochondria (Mit).
Figure 3.
Figure 3.
Saccharomyces cerevisiae fitness declines along the evolution experiment. We represent the growth curves for six isolated colonies at different passages (p20, p30, p50, p70, p90, and p100) for each of the five independently evolved lines of S. cerevisiae (MA1 to MA5). Growth was measured using absorbance at 600 nm.
Figure 4.
Figure 4.
Saccharomyces cerevisiae declines in fitness in the first passages of its evolution and recovers fitness in the later passages. We show the deceleration in the rate of growth decline as the experimental evolution proceeds. We took the logarithm of the optic density measured in stationary phase for cells isolated at different passage points of the experiment. Each dot is the median of four different growth curves. (Inset) Dynamic of accumulation of synonymous and nonsynonymous SNPs (SSNPs and NSNPs, respectively), across the experiment for the six passage points averaged for all five experimentally evolving lineages.
Figure 5.
Figure 5.
Duplicates tolerate more nonsynonymous SNPs (NSNPs) than singletons. (A) A larger proportion of duplicates accumulate NSNPs (black portions) than singletons. (B) Most of the tolerance to NSNPs is found in duplicates originated by small-scale duplications (SSD), while those originated by whole-genome duplication (WGD) are not more enriched for NSNPs than are singletons when taking each duplicate as an independent gene.
Figure 6.
Figure 6.
Duplicate gene copies that interact genetically are more enriched for nonsynonymous SNPs (NSNPs) than genetically interacting singletons. We built a distribution of singleton interacting pairs randomly sampled that was not biased by highly interacting singletons. (A) Duplicate interacting pairs are more enriched for NSNPs than expected (black arrow; probability of the number of observed duplicates with NSNPs is indicated above the arrow). (B) Pairs of whole-genome duplicates (WGDs) with interacting gene copies are not more enriched than expected. (C) Small-scale duplicates (SSDs) with interacting gene copies are more enriched for NSNPs than expected.
Figure 7.
Figure 7.
The number of SNPs in the promoter regions of duplicates (black column) is larger than that in the promoters of singletons (white column). This figure is built taking only those SNPs that fall within the 600 nucleotides upstream coding regions.
Figure 8.
Figure 8.
Duplicates show more expression plasticity than singletons under stress conditions. (A) Mutations at duplicate promoters occur at more conserved regions than those at singleton promoters. Conservation coefficient is calculated by measuring the amount of entropy in each nucleotide site of the alignment that comprised upstream regions of genes in S. cerevisiae and at least five other closely related orthologs. Duplicates show larger conservation in their mutated sites than expected, while singletons show less conservation than expected. (B) Two examples of the conservation of mutated sites at duplicate (PEX27) and singleton (STE24) promoter regions. Red dots represent mutated nucleotide sites during our evolution experiment. The first site from the initiation codon is also labeled (+1). (C) We analyzed 32 stress conditions from various independent studies (Supplemental Table S7). The phenotypic (expression) plasticity of genes, both the duplicates (D) and singletons (S), was calculated as the difference in the expression of the gene between two environmental conditions (Ei and Ej): formula image
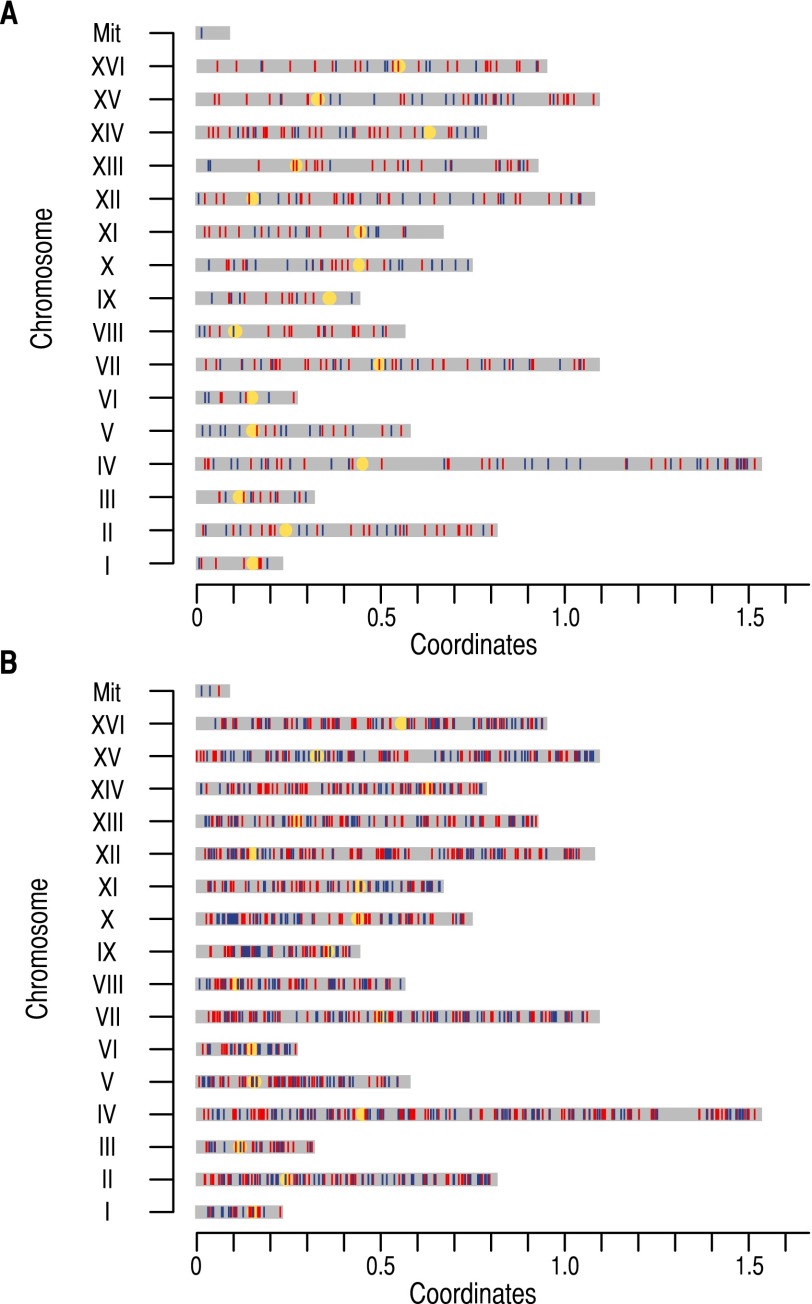
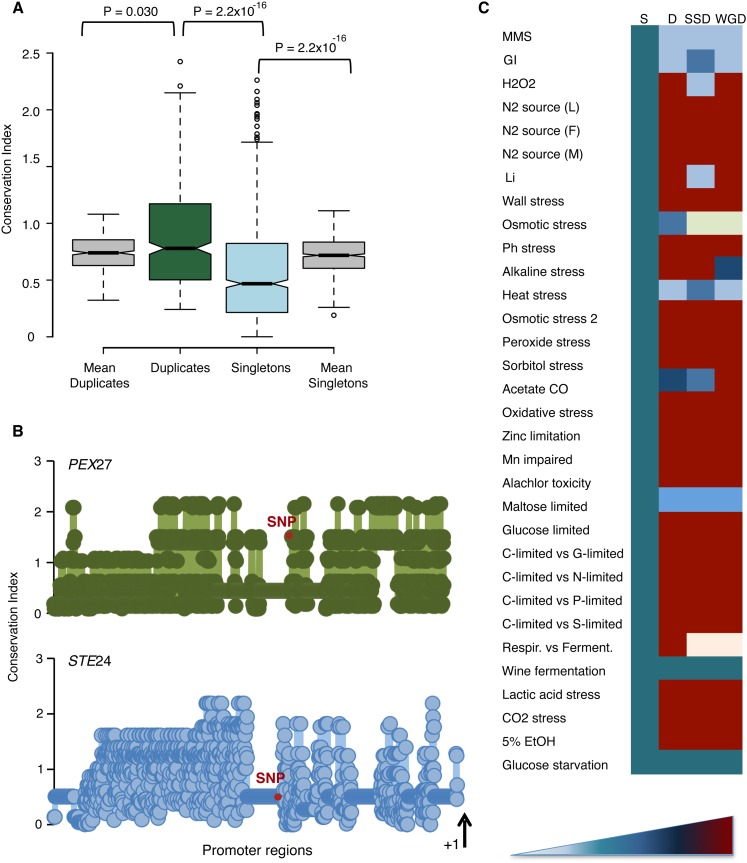
. Duplicates with larger expression plasticity are colored in red; squares are colored in blue that becomes lighter as the difference in expression decreases between the duplicates; and light yellow indicates that the corresponding information is not sufficiently large to perform statistical tests.

References

    1. Altschul SF, Madden TL, Schaffer AA, Zhang J, Zhang Z, Miller W, Lipman DJ. 1997. Gapped BLAST and PSI-BLAST: a new generation of protein database search programs. Nucleic Acids Res 25: 3389–3402 - PMC - PubMed
    1. Barkman T, Zhang J. 2009. Evidence for escape from adaptive conflict? Nature 462: E1. - PubMed
    1. Birchler JA, Riddle NC, Auger DL, Veitia RA. 2005. Dosage balance in gene regulation: biological implications. Trends Genet 21: 219–226 - PubMed
    1. Blanc G, Wolfe KH. 2004a. Functional divergence of duplicated genes formed by polyploidy during Arabidopsis evolution. Plant Cell 16: 1679–1691 - PMC - PubMed
    1. Blanc G, Wolfe KH. 2004b. Widespread paleopolyploidy in model plant species inferred from age distributions of duplicate genes. Plant Cell 16: 1667–1678 - PMC - PubMed

Publication types

Associated data