

Emergence of robust growth laws from optimal regulation of ribosome synthesis
- PMID: 25149558
- PMCID: PMC4299513
- DOI: 10.15252/msb.20145379
Emergence of robust growth laws from optimal regulation of ribosome synthesis
Abstract
Bacteria must constantly adapt their growth to changes in nutrient availability; yet despite large-scale changes in protein expression associated with sensing, adaptation, and processing different environmental nutrients, simple growth laws connect the ribosome abundance and the growth rate. Here, we investigate the origin of these growth laws by analyzing the features of ribosomal regulation that coordinate proteome-wide expression changes with cell growth in a variety of nutrient conditions in the model organism Escherichia coli. We identify supply-driven feedforward activation of ribosomal protein synthesis as the key regulatory motif maximizing amino acid flux, and autonomously guiding a cell to achieve optimal growth in different environments. The growth laws emerge naturally from the robust regulatory strategy underlying growth rate control, irrespective of the details of the molecular implementation. The study highlights the interplay between phenomenological modeling and molecular mechanisms in uncovering fundamental operating constraints, with implications for endogenous and synthetic design of microorganisms.
Keywords: growth control; metabolic control; phenomenological model; resource allocation; synthetic biology.
© 2014 The Authors. Published under the terms of the CC BY 4.0 license.
Figures
 .
.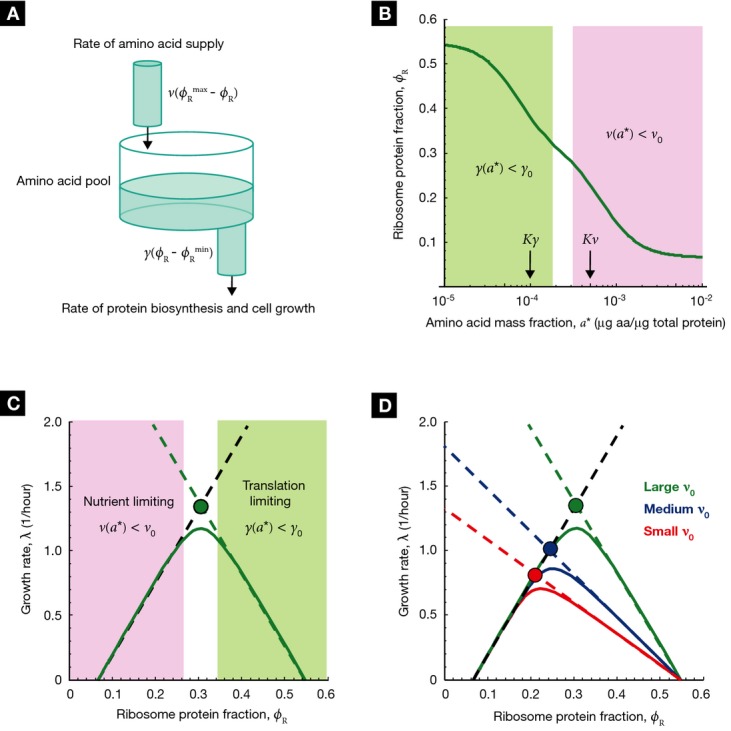
 , must balance the supply rate via transport
and biosynthesis, νϕP [equation (12)], to maintain a constant amino acid pool size.
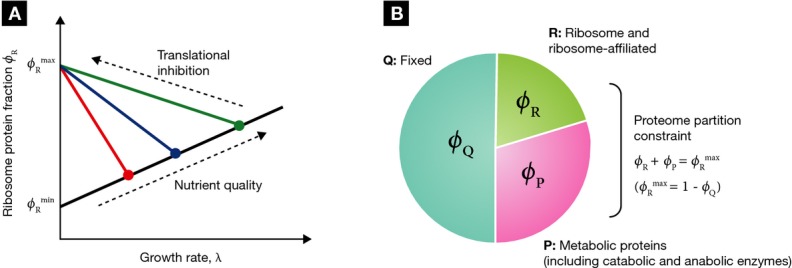
Using the proteome partitioning constraint that ribosomal protein fraction ϕR and
metabolic protein fraction ϕP sum to a constant,
, must balance the supply rate via transport
and biosynthesis, νϕP [equation (12)], to maintain a constant amino acid pool size.
Using the proteome partitioning constraint that ribosomal protein fraction ϕR and
metabolic protein fraction ϕP sum to a constant,  (Fig 1B), the supply rate can be written as
 . The cell then must regulate the ribosomal
protein fraction ϕR to both balance and maximize the flux through the system. (B)
The ribosomal protein fraction ϕR determines the steady-state amino acid level
a* (green solid line) and consequently the growth rate λ
[equation (17)], when the amino acid
flux is balanced. (C) The growth rate λ (green solid line) exhibits a unique maximum
corresponding to an optimal size of the ribosomal protein fraction ϕR. The upper
bound on the growth rate maximum occurs when the translational efficiency
. The cell then must regulate the ribosomal
protein fraction ϕR to both balance and maximize the flux through the system. (B)
The ribosomal protein fraction ϕR determines the steady-state amino acid level
a* (green solid line) and consequently the growth rate λ
[equation (17)], when the amino acid
flux is balanced. (C) The growth rate λ (green solid line) exhibits a unique maximum
corresponding to an optimal size of the ribosomal protein fraction ϕR. The upper
bound on the growth rate maximum occurs when the translational efficiency
 and nutritional efficiency
 are both maximal for a given nutrient
environment,
are both maximal for a given nutrient
environment,  and
and  (filled circle). (D) The optimal size of the ribosomal protein fraction ϕR depends
upon the growth environment (filled circles), illustrated here by a change in the nutrient quality
of the medium: poor nutrient ν0 = 2.5/h (red solid line),
good nutrient ν0 = 3.3/h (blue solid line), and rich
nutrient ν0 = 5.8/h (green solid line). Dashed lines
correspond to the empirical relations shown in Fig 1A,
(filled circle). (D) The optimal size of the ribosomal protein fraction ϕR depends
upon the growth environment (filled circles), illustrated here by a change in the nutrient quality
of the medium: poor nutrient ν0 = 2.5/h (red solid line),
good nutrient ν0 = 3.3/h (blue solid line), and rich
nutrient ν0 = 5.8/h (green solid line). Dashed lines
correspond to the empirical relations shown in Fig 1A,
 (black dashed line) and
 (colored dashed lines). The amino acid level
for efficient peptide elongation Kγ =
10−4, and the level to trigger negative feedback inhibition of amino acid supply
Kν =
5Kγ = 5 × 10⁻⁴. The remaining
parameters are γ0 = 5.9/h,
(colored dashed lines). The amino acid level
for efficient peptide elongation Kγ =
10−4, and the level to trigger negative feedback inhibition of amino acid supply
Kν =
5Kγ = 5 × 10⁻⁴. The remaining
parameters are γ0 = 5.9/h,  = 0.07 and
  = 0.55 (Scott et al,
2010).
= 0.55 (Scott et al,
2010).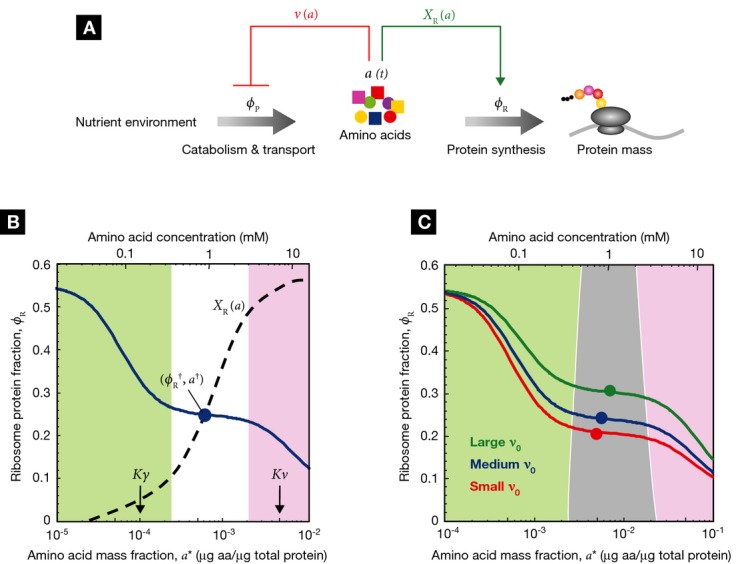
 (red block arrow) via regulation of protein
expression (described by ηa) or allosteric
inhibition (described by a decrease in efficacy ka).
Negative feedback inhibition is important to rapidly regain steady-state growth upon nutrient shift,
but plays an auxiliary role in growth rate maximization. When internal amino acid pools increase,
supply-driven activation of ribosomal protein synthesis
(red block arrow) via regulation of protein
expression (described by ηa) or allosteric
inhibition (described by a decrease in efficacy ka).
Negative feedback inhibition is important to rapidly regain steady-state growth upon nutrient shift,
but plays an auxiliary role in growth rate maximization. When internal amino acid pools increase,
supply-driven activation of ribosomal protein synthesis  (green arrow) increases the rate of consumption to restore flux balance. (B) If the amino acid level
for efficient elongation (Kγ) and the level for
negative feedback inhibition of amino acid supply
(Kν) are well separated,
Kγ <<
Kν, then the ribosomal protein fraction
ϕR (blue solid line) is only weakly dependent on the steady-state amino acid level
a* close to the optimal value
(green arrow) increases the rate of consumption to restore flux balance. (B) If the amino acid level
for efficient elongation (Kγ) and the level for
negative feedback inhibition of amino acid supply
(Kν) are well separated,
Kγ <<
Kν, then the ribosomal protein fraction
ϕR (blue solid line) is only weakly dependent on the steady-state amino acid level
a* close to the optimal value  (filled circle) (lower axis displays amino acid level in units of mass fraction, upper axis displays
the corresponding level in units of concentration). The intersection of
(filled circle) (lower axis displays amino acid level in units of mass fraction, upper axis displays
the corresponding level in units of concentration). The intersection of
 (blue line) and the ribosome synthesis
function
(blue line) and the ribosome synthesis
function  defines the steady state of the system (Supplementary Fig S2). A ribosome synthesis
control function
defines the steady state of the system (Supplementary Fig S2). A ribosome synthesis
control function  (dashed line) is shown passing through
 that yields the optimal ribosomal protein
fraction
that yields the optimal ribosomal protein
fraction  and growth rate
 . Notice that any curve intersecting
ϕR in the plateau (white region) will return a steady-state ribosomal protein
fraction close to the optimum,
. Notice that any curve intersecting
ϕR in the plateau (white region) will return a steady-state ribosomal protein
fraction close to the optimum,  .
(C) Control functions
.
(C) Control functions  that pass through this plateau provide
autonomous optimal control of the ribosomal protein fraction over a range of nutrient conditions.
The dark gray band illustrates the range of control functions
that pass through this plateau provide
autonomous optimal control of the ribosomal protein fraction over a range of nutrient conditions.
The dark gray band illustrates the range of control functions  that determine ribosomal protein fraction ϕR to within 10% of the optimum
 over a range of nutrient conditions. The
colored lines and symbols correspond to those in Fig 2, with
ν0 = 2.5/h (red), ν0
= 3.3/h (blue), and ν0 = 5.8/h (green);
Kγ = 10−4, and
Kν =
50Kγ = 5 × 10⁻³. Experimental
estimates for Kγ,
Kν, and steady-state amino acid pool sizes are
given in Supplementary Table S1
(illustrated in Supplementary Fig S3).
over a range of nutrient conditions. The
colored lines and symbols correspond to those in Fig 2, with
ν0 = 2.5/h (red), ν0
= 3.3/h (blue), and ν0 = 5.8/h (green);
Kγ = 10−4, and
Kν =
50Kγ = 5 × 10⁻³. Experimental
estimates for Kγ,
Kν, and steady-state amino acid pool sizes are
given in Supplementary Table S1
(illustrated in Supplementary Fig S3).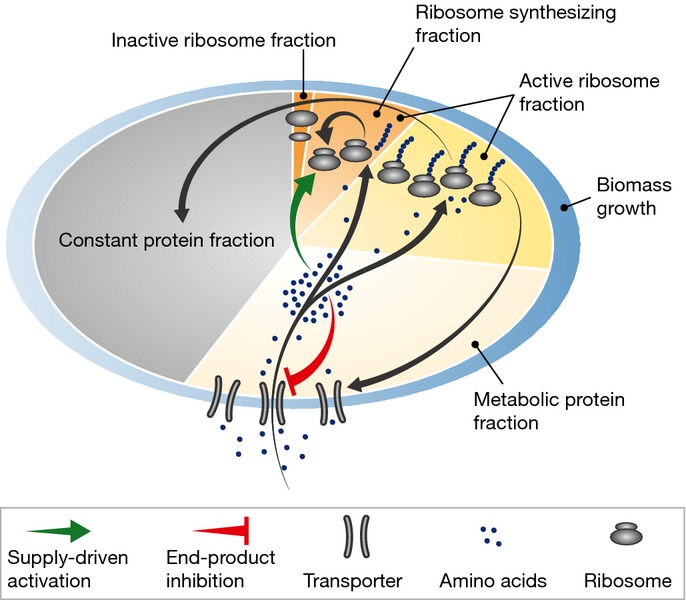
References
-
- Armstrong JB, Fairfield JA. A new method for the isolation of methionyl transfer RNA synthetase mutants from Escherichia coli. Can J Microbiol. 1975;21:754–758. - PubMed
-
- Ataide SF, Ibba M. Discrimination of cognate and noncognate substrates at the active site of class II lysyl-tRNA synthetase. Biochemistry. 2004;43:11836–11841. - PubMed
MeSH terms
Substances
Grants and funding
LinkOut - more resources
Full Text Sources
Other Literature Sources
