

Establishment and analysis of a reference transcriptome for Spodoptera frugiperda
- PMID: 25149648
- PMCID: PMC4150953
- DOI: 10.1186/1471-2164-15-704
Establishment and analysis of a reference transcriptome for Spodoptera frugiperda
Abstract
Background: Spodoptera frugiperda (Noctuidae) is a major agricultural pest throughout the American continent. The highly polyphagous larvae are frequently devastating crops of importance such as corn, sorghum, cotton and grass. In addition, the Sf9 cell line, widely used in biochemistry for in vitro protein production, is derived from S. frugiperda tissues. Many research groups are using S. frugiperda as a model organism to investigate questions such as plant adaptation, pest behavior or resistance to pesticides.
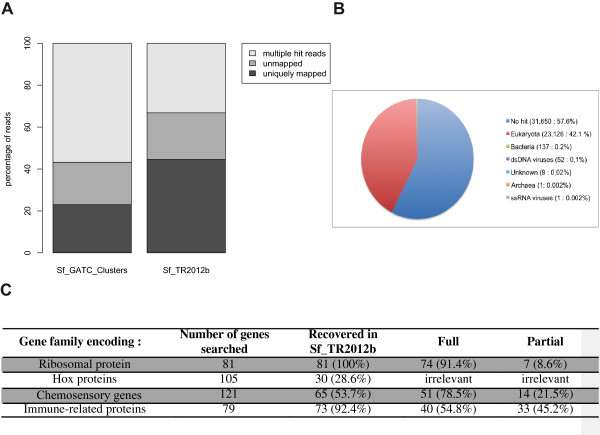
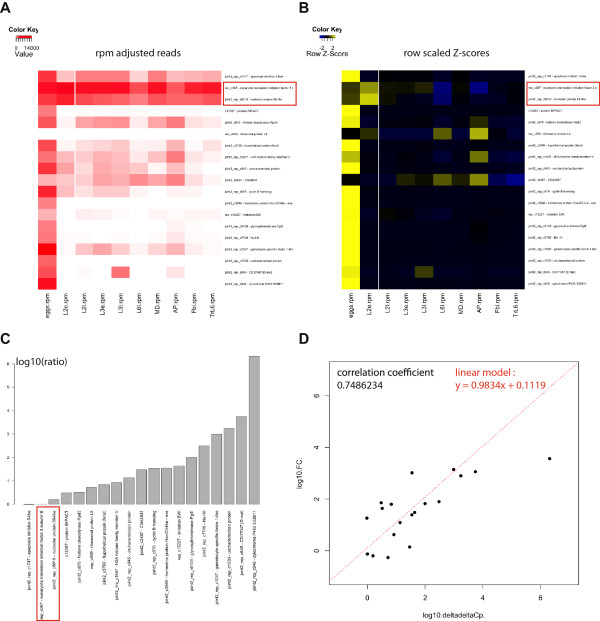
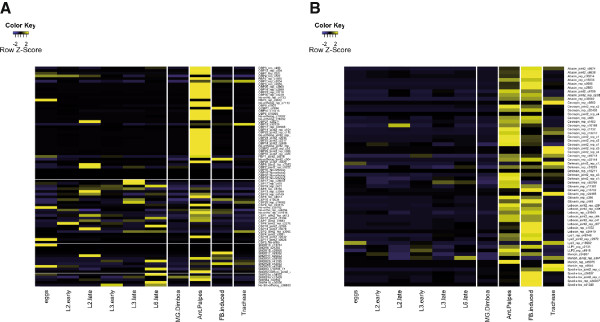
Results: In this study, we constructed a reference transcriptome assembly (Sf_TR2012b) of RNA sequences obtained from more than 35 S. frugiperda developmental time-points and tissue samples. We assessed the quality of this reference transcriptome by annotating a ubiquitous gene family--ribosomal proteins--as well as gene families that have a more constrained spatio-temporal expression and are involved in development, immunity and olfaction. We also provide a time-course of expression that we used to characterize the transcriptional regulation of the gene families studied.
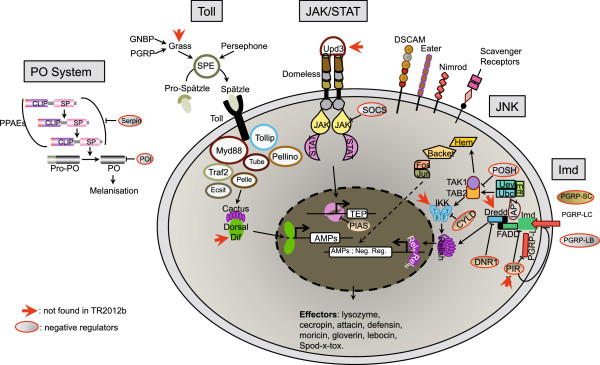
Conclusion: We conclude that the Sf_TR2012b transcriptome is a valid reference transcriptome. While its reliability decreases for the detection and annotation of genes under strong transcriptional constraint we still recover a fair percentage of tissue-specific transcripts. That allowed us to explore the spatial and temporal expression of genes and to observe that some olfactory receptors are expressed in antennae and palps but also in other non related tissues such as fat bodies. Similarly, we observed an interesting interplay of gene families involved in immunity between fat bodies and antennae.
Figures
Similar articles
-
Comparative transcriptome analysis of lufenuron-resistant and susceptible strains of Spodoptera frugiperda (Lepidoptera: Noctuidae).BMC Genomics. 2015 Nov 21;16:985. doi: 10.1186/s12864-015-2183-z. BMC Genomics. 2015. PMID: 26589731 Free PMC article.
-
A comparison of the olfactory gene repertoires of adults and larvae in the noctuid moth Spodoptera littoralis.PLoS One. 2013;8(4):e60263. doi: 10.1371/journal.pone.0060263. Epub 2013 Apr 2. PLoS One. 2013. PMID: 23565215 Free PMC article.
-
Identification and phylogenetics of Spodoptera frugiperda chemosensory proteins based on antennal transcriptome data.Comp Biochem Physiol Part D Genomics Proteomics. 2020 Jun;34:100680. doi: 10.1016/j.cbd.2020.100680. Epub 2020 Mar 5. Comp Biochem Physiol Part D Genomics Proteomics. 2020. PMID: 32278289
-
Expression profiles analysis and roles in immunity of transient receptor potential (TRP) channel genes in Spodoptera frugiperda.BMC Genomics. 2025 Apr 24;26(1):401. doi: 10.1186/s12864-025-11599-6. BMC Genomics. 2025. PMID: 40275159 Free PMC article.
-
Transcriptome Analysis of Gene Families Involved in Chemosensory Function in Spodoptera littoralis (Lepidoptera: Noctuidae).BMC Genomics. 2019 May 28;20(1):428. doi: 10.1186/s12864-019-5815-x. BMC Genomics. 2019. PMID: 31138111 Free PMC article.
Cited by
-
Transcriptome Analysis of the Spodoptera frugiperda Ascovirus In Vivo Provides Insights into How Its Apoptosis Inhibitors and Caspase Promote Increased Synthesis of Viral Vesicles and Virion Progeny.J Virol. 2017 Nov 14;91(23):e00874-17. doi: 10.1128/JVI.00874-17. Print 2017 Dec 1. J Virol. 2017. PMID: 28956762 Free PMC article.
-
Functional identification of PsMYB57 involved in anthocyanin regulation of tree peony.BMC Genet. 2020 Nov 16;21(1):124. doi: 10.1186/s12863-020-00930-7. BMC Genet. 2020. PMID: 33198624 Free PMC article.
-
Sequencing, de novo assembly and annotation of a pink bollworm larval midgut transcriptome.Gigascience. 2016 Jun 22;5:28. doi: 10.1186/s13742-016-0130-9. Gigascience. 2016. PMID: 27333791 Free PMC article.
-
Interaction of a Densovirus with Glycans of the Peritrophic Matrix Mediates Oral Infection of the Lepidopteran Pest Spodoptera frugiperda.Viruses. 2019 Sep 17;11(9):870. doi: 10.3390/v11090870. Viruses. 2019. PMID: 31533310 Free PMC article.
-
Alternative transcript splicing regulates UDP-glucosyltransferase-catalyzed detoxification of DIMBOA in the fall armyworm (Spodoptera frugiperda).Sci Rep. 2022 Jun 20;12(1):10343. doi: 10.1038/s41598-022-14551-w. Sci Rep. 2022. PMID: 35725775 Free PMC article.
References
-
- Wetterstrand KA: DNA Sequencing Costs: Data from the NHGRI Genome Sequencing Program (GSP). Available at: http://www.genome.gov/sequencingcosts. Accessed [date of access]
-
- Capinera JL. Handbook of Vegetable Pests. Vol. 1. San Diego, CA, USA: Academic Press; 2001. p. 729.
-
- Pogue MG. A World Revision of the Genus Spodoptera Guenée : (Lepidoptera: Noctuidae) Philadelphia: American Entomological Society; 2002.
-
- Chevreux B, Wetter T, Suhai S. Computer Science and Biology: Proceedings of the German Conference on Bioinformatics (GCB) 99: 1999. 1999. Genome Sequence Assembly Using Trace Signals and Additional Sequence Information; pp. 45–46.
Publication types
MeSH terms
Substances
LinkOut - more resources
Full Text Sources
Other Literature Sources
