. 2014 Nov:97:35-48.
doi: 10.1016/j.tpb.2014.08.002. Epub 2014 Aug 18.

A renewal theory approach to IBD sharing

Affiliations

A renewal theory approach to IBD sharing

Shai Carmi et al. Theor Popul Biol. 2014 Nov.

Abstract

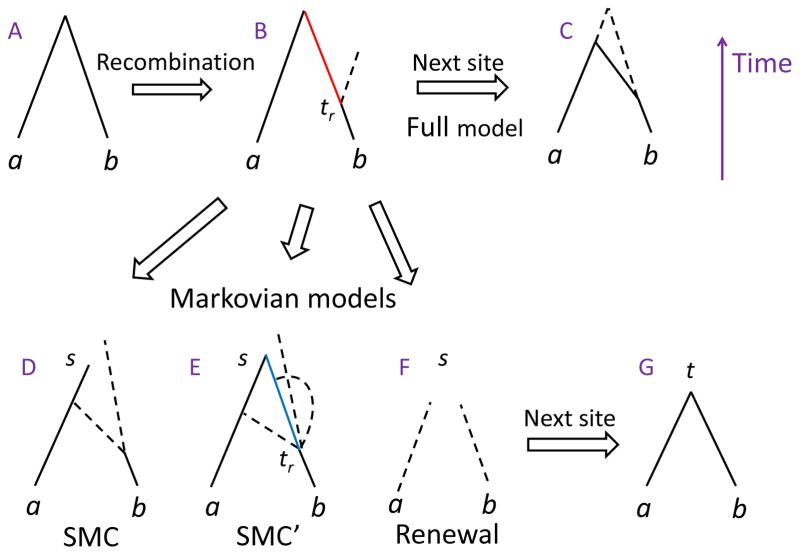
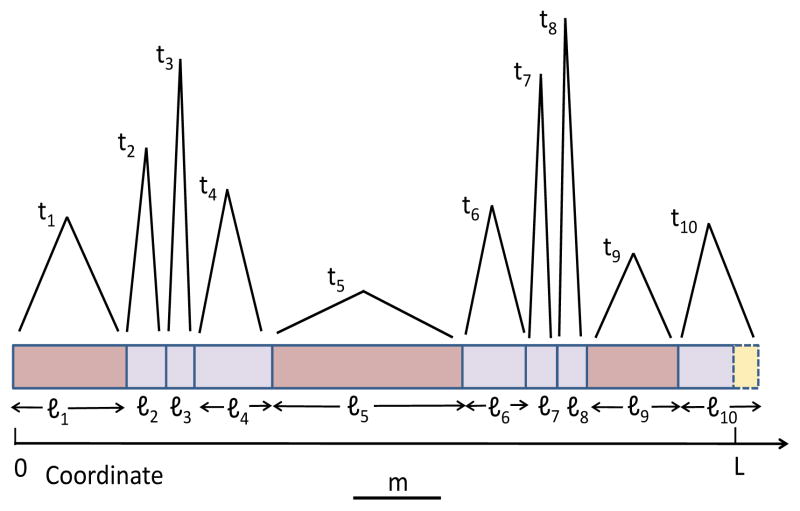
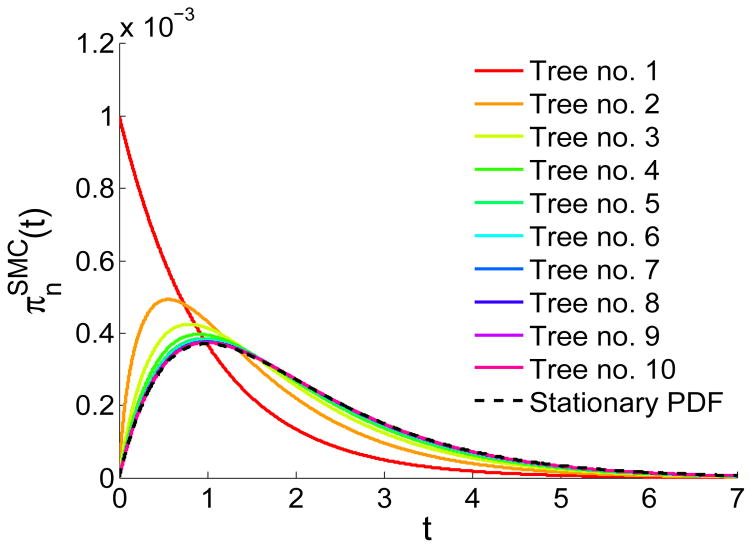
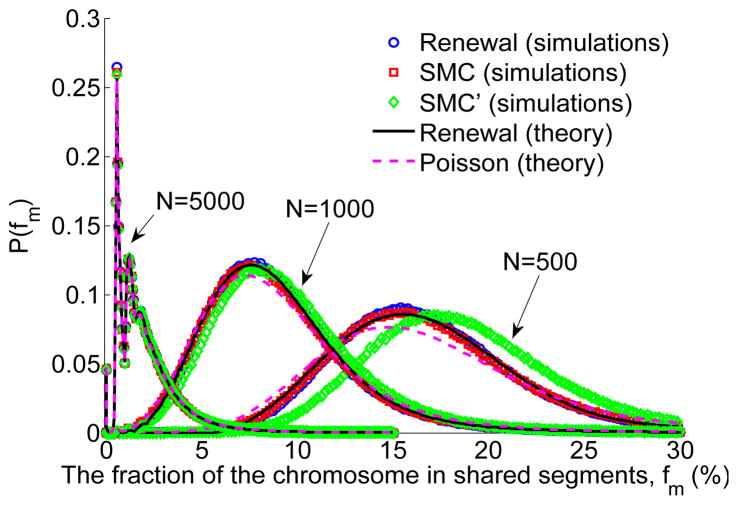
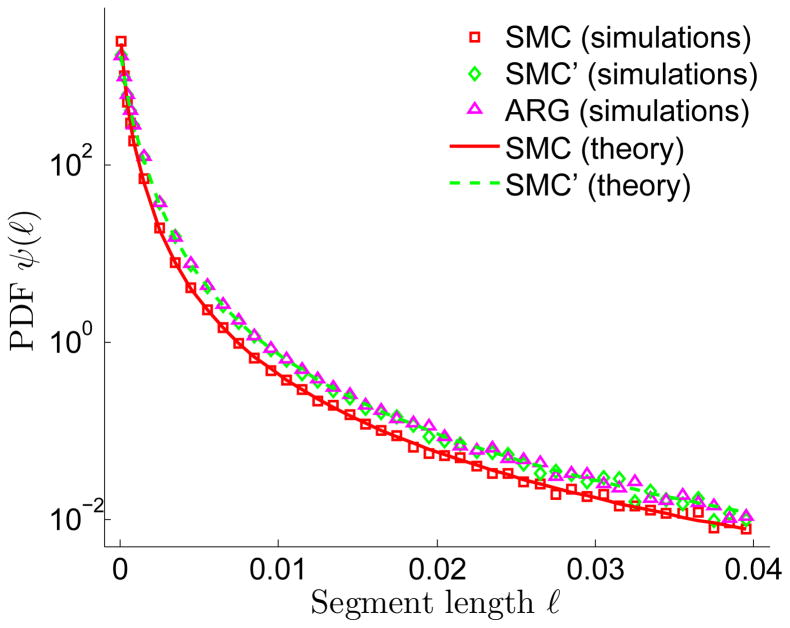
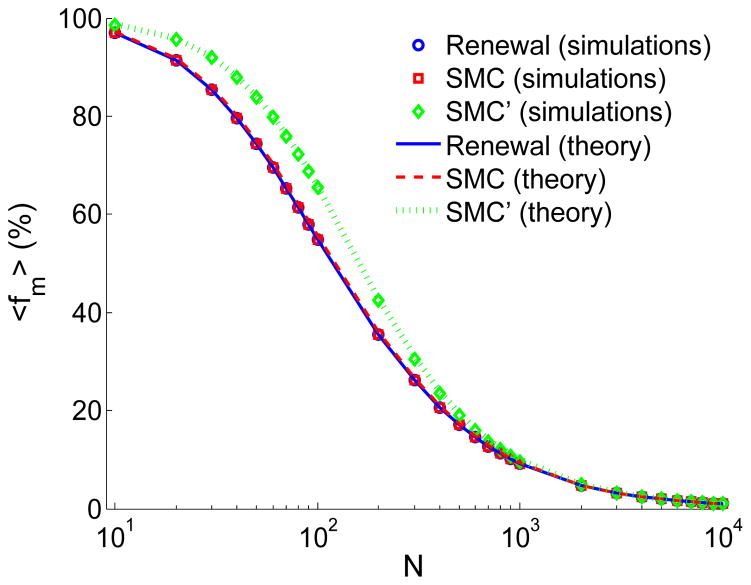
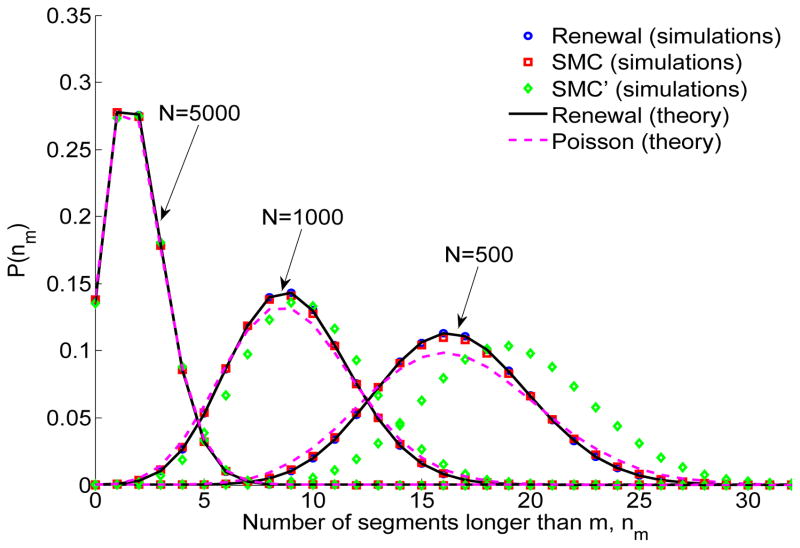
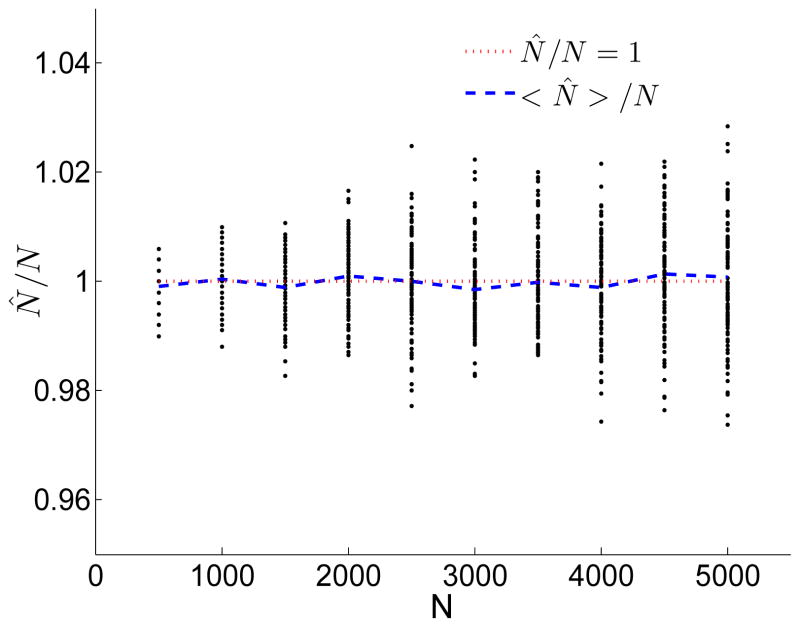
A long genomic segment inherited by a pair of individuals from a single, recent common ancestor is said to be identical-by-descent (IBD). Shared IBD segments have numerous applications in genetics, from demographic inference to phasing, imputation, pedigree reconstruction, and disease mapping. Here, we provide a theoretical analysis of IBD sharing under Markovian approximations of the coalescent with recombination. We describe a general framework for the IBD process along the chromosome under the Markovian models (SMC/SMC'), as well as introduce and justify a new model, which we term the renewal approximation, under which lengths of successive segments are independent. Then, considering the infinite-chromosome limit of the IBD process, we recover previous results (for SMC) and derive new results (for SMC') for the mean number of shared segments longer than a cutoff and the fraction of the chromosome found in such segments. We then use renewal theory to derive an expression (in Laplace space) for the distribution of the number of shared segments and demonstrate implications for demographic inference. We also compute (again, in Laplace space) the distribution of the fraction of the chromosome in shared segments, from which we obtain explicit expressions for the first two moments. Finally, we generalize all results to populations with a variable effective size.

Keywords: Coalescent theory; IBD sharing; Recombination; Renewal theory; SMC; SMC’.


Figures

Figure 1
Figure 1
An illustration of the coalescent with recombination for two chromosomes, and the associated Markovian approximations. Part A shows the coalescent tree at a random site. The two extant chromosomes are denoted a and b. Part B is indicating a recombination event occurring at time tr. The old branch connecting the breakpoint and the MRCA is colored red, and the branching lineage is shown as a dashed line. Under the full model of the coalescent with recombination (Wiuf and Hein (1999); C), the new lineage can coalesce with any branch in the existing tree (in this example, earlier than the previous TMRCA), and both the old lineage (which is not ancestral to the sample anymore) and the new lineage are carried over to the next site. The ‘marginal’ tree at the new site is shown in solid lines; the remainder of the ARG is in dashed lines. The Markovian approximations are presented in parts DG, where the current TMRCA is denoted as s and the new as t. In SMC (McVean and Cardin (2005); D), the old branch (red in B) is deleted, and the branching lineage can coalesce only with the lineage corresponding to the other chromosome (either earlier or later than the previous TMRCA; corresponding to the two dashed lines). In SMC′ (Marjoram and Wall (2006); E), the branching lineage can coalesce with the old branch (blue), but that branch is deleted once the new tree is formed. Under the renewal approximation (F), the new tree height is drawn independently of the previous tree height. In all Markovian approximations, the new tree (G) contains only the lineages ancestral to the sample at that position.
Figure 2
Figure 2
An illustration of the IBD process along the chromosome under SMC. Segments are broken by recombination events (vertical bars). The TMRCA is shown on top of each segment. Given a TMRCA ti at segment i, the segment length, i, is distributed exponentially with rate 2Nti, and the TMRCA at the next segment, ti+1, is distributed according to Eq. (1). The minimal segment length, m, is shown as a horizontal bar under the chromosome. Segments longer than m are shown in dark pink. In this example, there are three such segments; hence nm = 3 and the fraction of the chromosome in shared segments is fm = (1 + 5 + 9)/L. Segments shorter than m are in light pink. The last segment exceeds the chromosome length; the excess length (yellow) is ignored.
Figure 3
Figure 3
Convergence of the distribution of tree heights in the SMC model. The first tree is distributed as et, according to the standard coalescent. Subsequent trees are distributed according to Eqs. (1) and (3). The integrals were solved numerically. The stationary PDF (dashed line; Eq. (2)) is reached quickly.
Figure 4
Figure 4
The distribution of the fraction of the chromosome found in shared segments longer than m, fm. We simulated the IBD process for three values of the population size (N = 500, 1000, 5000), for L = 2 and m = 0.01 (Morgans), for SMC (the process defined in Table 1, section 2.2), the renewal approximation (Table 2, section 2.3), and SMC′ (Table 3, section 2.4), and for 106 realizations for each setting. The distribution for N = 5000 was divided by 3 for visibility. For all population sizes, SMC and the renewal approximation produced identical results, which also agree well with the renewal theory result (numerical inversion (Hollenbeck, 1998; de Hoog et al., 1982) of Eq. (B.3))). SMC′ and the Poisson approximation (Eq. (47)) deviate from SMC/renewal, increasingly for smaller values of N. The fluctuations for N = 5000 are due to the sharing of exactly 0,1,2,… segments of length very close to m, and were previously described (Carmi et al., 2013).
Figure 5
Figure 5
The distribution of segment lengths, ψ(), under SMC, SMC′, and the ARG. Simulations for SMC and SMC′ were as described in Figure 4, but with N = 1000 and L = 0.5 (Morgan). ARG simulations were performed in ms, by outputting the marginal trees and extracting segment lengths. We ran 5000 realizations for each model. Theory for SMC is from Eq. (4) and theory for SMC′ is from Eq. (10) (equivalently (A.1)). Interestingly, simulation results for the ARG are indistinguishable from those of SMC′.
Figure 6
Figure 6
The mean fraction of the chromosome found in shared segments longer than m, 〈 fm 〉. Simulation details are as in Figure 4. Simulation results and theory for SMC and the renewal approximation coincide. The renewal theory curve was obtained by numerically inverting Eq. (41). Theory for SMC and SMC′ (infinite-chromosome limits) is from Eqs. (17) and (A.3), respectively.
Figure 7
Figure 7
The distribution of the number of shared segments longer than m, nm. Simulation details are as in Figure 4 (specifically, L = 2 and m = 0.01 (Morgans)). Theory for the renewal approximation was obtained by numerically inverting Eq. (B.1). The Poisson distribution has mean 2N L/(1 + 2mN)2 (Eq. (16)).
Figure 8
Figure 8
Inference of the effective population size using the distribution of the number of shared segments longer than m. Simulations for N = 500, 1000, …, 5000 were performed as in Figure 4 and for R = 5000 pairs of chromosomes, and Eq. (37) was used to compute N^, the estimator of the population size. We then repeated 100 times for each N, and each ratio N^/N is shown as a dot. The dotted red line represents N^ = N and the blue line shows 〈 N^〉/N. The estimator in unbiased, with standard deviation as low as 0.003N for N = 500 and 0.011N for N = 5000.
Figure 9
Figure 9
The variance of the fraction of the chromosome found in shared segments longer than m, Var [fm]. Simulation details are as in Figure 4. The inset zooms in on the small N region. The renewal theory curve is the large L expansion given in Eq. (43). The line representing Carmi et al. (2013) is from Eq. (44), and the Poisson expression is from Eq. (50).

References

    1. Atzmon G, Hao L, Pe’er I, Velez C, Pearlman A, Palamara PF, Morrow B, Friedman E, Oddoux C, Burns E, Ostrer H. Abraham’s children in the genome era: Major Jewish diaspora populations comprise distinct genetic clusters with shared middle eastern ancestry. Am J Hum Genet. 2010;86:850–859. - PMC - PubMed
    1. Botigué LR, Henn BM, Gravel S, Maples BK, Gignoux CR, Corona E, Atzmon G, Burns E, Ostrer H, Flores C, Bertranpetit J, Comas D, Bustamante CD. Gene flow from North Africa contributes to differential human genetic diversity in Southern Europe. Proc Natl Acad Sci USA. 2013;110:11791–11796. - PMC - PubMed
    1. Brančík L. Numerical Inverse Laplace Transforms for Electrical Engineering Simulation, MATLAB for Engineers - Applications in Control, Electrical Engineering, IT and Robotics. InTech; 2011.
    1. Bray SM, Mulle JG, Dodd AF, Pulver AE, Wooding S, Warren ST. Signatures of founder effects, admixture, and selection in the Ashkenazi Jewish population. P Natl Acad Sci USA. 2010;107:16222–16227. - PMC - PubMed
    1. Brown MD, Glazner CG, Zheng C, Thompson EA. Inferring coancestry in population samples in the presence of linkage disequilibrium. Genetics. 2012;190:1447–1460. - PMC - PubMed

Publication types

LinkOut - more resources