. 2014 Sep;20(9):1035-42.
doi: 10.1038/nm.3666. Epub 2014 Aug 24.

The G protein α subunit Gαs is a tumor suppressor in Sonic hedgehog-driven medulloblastoma

Affiliations

The G protein α subunit Gαs is a tumor suppressor in Sonic hedgehog-driven medulloblastoma

Xuelian He et al. Nat Med. 2014 Sep.

Abstract

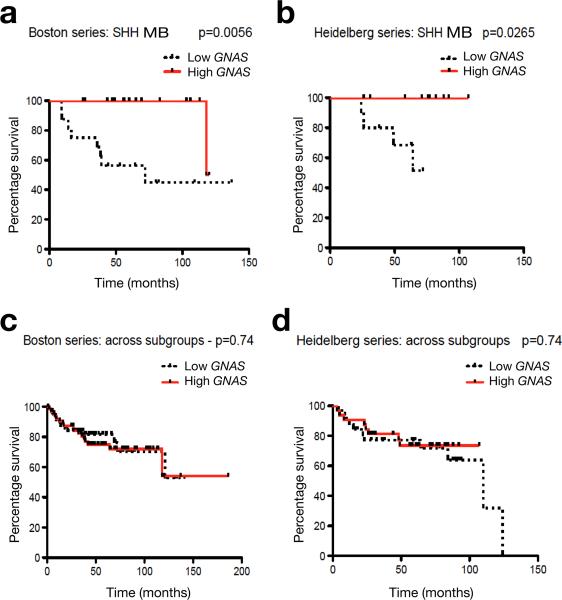
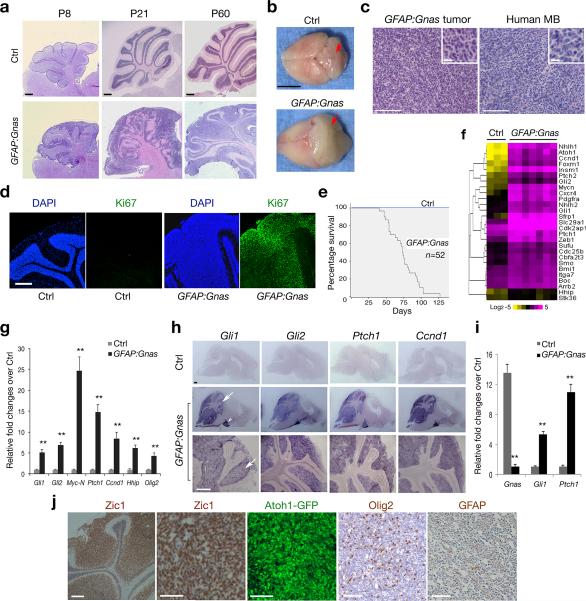
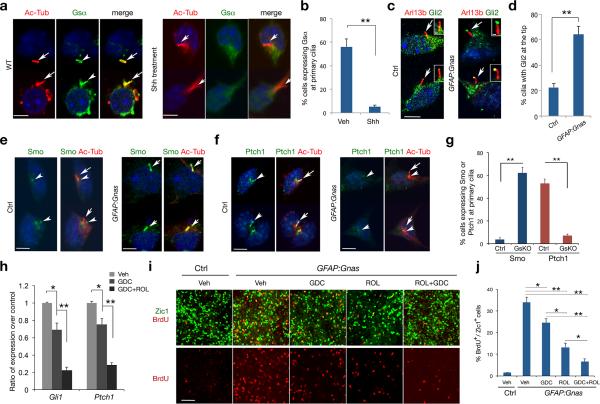
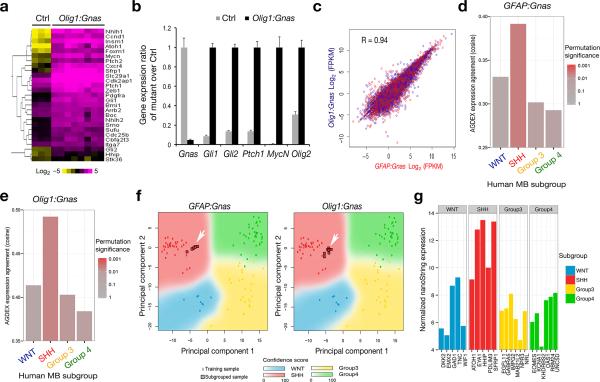
Medulloblastoma, the most common malignant childhood brain tumor, exhibits distinct molecular subtypes and cellular origins. Genetic alterations driving medulloblastoma initiation and progression remain poorly understood. Herein, we identify GNAS, encoding the G protein Gαs, as a potent tumor suppressor gene that, when expressed at low levels, defines a subset of aggressive Sonic hedgehog (SHH)-driven human medulloblastomas. Ablation of the single Gnas gene in anatomically distinct progenitors in mice is sufficient to induce Shh-associated medulloblastomas, which recapitulate their human counterparts. Gαs is highly enriched at the primary cilium of granule neuron precursors and suppresses Shh signaling by regulating both the cAMP-dependent pathway and ciliary trafficking of Hedgehog pathway components. Elevation in levels of a Gαs effector, cAMP, effectively inhibits tumor cell proliferation and progression in Gnas-ablated mice. Thus, our gain- and loss-of-function studies identify a previously unrecognized tumor suppressor function for Gαs that can be found consistently across Shh-group medulloblastomas of disparate cellular and anatomical origins, highlighting G protein modulation as a potential therapeutic avenue.


Figures

Figure 1
Figure 1. GNAS defines a subset of aggressive SHH-group tumors
(a-d) MB patients with available survival information and gene expression profiling studies from both Boston and Heidelberg series of MBs , were divided into two groups using the median GNAS expression value as the cutoff point. The relationship between GNAS mRNA expression and survival time was analyzed according to the Kaplan-Meier method, using log rank statistics. GNAS levels and patient numbers: a, low (n =16), high (n =17); b, low (n = 10), high (n = 10); c, low (n = 32), high (n = 32); d, low (n = 64), high (n = 65).
Figure 2
Figure 2. Loss of Gnas in neural stem/progenitor cells induces MB formation
(a) Sagittal brain sections from hGFAPCre:Gnaslox/lox (GFAP:Gnas) and hGFAPCre:Gnaslox/+ (Ctrl) mice at indicated stages were stained with hematoxylin and eosin (H/E). (b) Brain appearance of control and Gnas mutants at P67. The arrows indicate the cerebellum. (c) Tumors from Gnas mutants (left) displays similar histology to human MB (right; SHH group). Insets are shown at high magnification. (d) The cerebella of control and Gnas mutants at P60 were stained with anti-Ki67 and DAPI. (e) Kaplan-Meier survival curves for control and GFAP:Gnas mice (n = 52). (f) Heatmap shows expression of Shh pathway components in control cerebella and GFAP:Gnas tumor tissues. The color bar shows expression intensity. (g) qRT-PCR quantification of Gnas and Shh pathway genes in control and GFAP:Gnas cerebella at P30. Data represent the mean ± SEM (n = six animals). ** P < 0.01; Student's t test. (h) mRNA expression of Shh target genes as indicated in control and GFAP:Gnas brain sections at P60. Arrow and arrowhead indicate the cerebellum and pontine grey nucleus, respectively. (i) qRT-PCR analysis of Gnas, Gli1 and Ptch1 in GNPs from control and GFAP:Gnas mice at P7. Data represent the mean ± SEM (n = five animals). ** P < 0.01; Student's t test. (j) The cerebellar EGL region of GFAP:Gnas mice carrying the Atoh1-GFP reporter at P50 was immunostained with anti-Zic1, Olig2 and GFAP as indicated. Scale bars in a, 300 μm; b, 5 mm; c, d, h, 200 μm; inset in c, 10 μm; j, 100 μm.
Figure 3
Figure 3. Gsα and its effector cAMP inhibit Shh signaling and tumor growth in Gnas mutants
(a) Bar graph (left) depicts expression changes in GNPs treated NF449 over control. Right: cAMP levels measured by ELISA. (b) GNPs were treated with vehicle and SAG (200 nM) and/or transfected with pcDNA3 control and GsαQ227L (pGsCA) for 48 h. Bar graphs depict Gli1 and Ptch1 expression changes in treated cells over control. (c) Average cAMP levels of control and mutant GNPs treated with vehicle and forskolin. (d) GNPs were treated with vehicle or Rolipram (50 μM), forskolin (10 μM) and db-cAMP (100 μM) for 3 h. Gli1 and Ptch1 or Gli3FL and Gli3R were analyzed by qRT-PCR (left) and western blotting (right) as indicated. GAPDH: loading control. (e) Quantification of Gli1, Ptch1 and Ccnd1 in GNPs treated with H89 or KT5720 over control. (f) Bar graphs depict the relative fold change of Gli1 and Ptch1 expression in GNPs transfected with pGsCA with or without H89 treatment over control. (g) Control and Gnas mice (n = eight for each group) were randomized to receive Rolipram or vehicle from P35 to P65. Representative images of H/E staining of cerebellar sections and brain morphology were shown. Arrows: the cerebellum. (h) Scatter dot-plot depicts average tumor volumes estimated for vehicle- and Rolipram-treated Gnas mutants. Lines: mean values ± SEM. (i) Images show immunostaining of Zic1 and BrdU in vehicle and Rolipram-treated GFAP:Gnas tumors at P65. Insets: high magnification in boxed areas. Bar graph (right) depicts the percentage of BrdU+/Zic1+ cells (n = eight animals each group). (j) Kaplan-Meier survival curves for GFAP:Gnas mice (n = 12 per group) were randomized to receive Rolipram or vehicle at P30 for six weeks. P value for the log-rank test =0.0071. Scale bars in g, 300 μm; i, 20 μm (insets 4 μm). Data shown in a-f are the mean ± SEM representing at least three independent experiments. *P < 0.05, ** P < 0.01; Student's t-test.
Figure 4
Figure 4. Gsα regulates ciliary trafficking of hedgehog signaling components in GNPs
(a-b) GNPs without or with Shh treatment (3 μg ml–1) for 16 hr were immunostained with anti-Gsα and acetylated α-tubulin (Ac-Tub) (arrows). b: quantitation of Gsα fluorescence at the primary cilium (≥ 300 cell counts each group per experiment). (c-g) GNPs from control or GFAP:Gnas mice were immunostained with anti-Gli2, Smo, Ptch1 and Ac-Tub. Insets in c show cilia at a high magnification. Bar graphs in d, g depict the percentage of Gli2 accumulation at cilium tips, and Smo or Ptch1 fluorescence at the primary cilium, respectively (≥ 300 cell counts per genotype from each experiment). Arrows and arrowheads indicate primary cilia and their base, respectively. (h) GNPs from Gnas mutants were treated with GDC-0449 (1 μm) or both GDC-0449 and Rolipram (50 μm). Bar graphs depict relative Gli1 and Ptch1 expression by qRT-PCR in drug-treated vs. vehicle-treated cells. (i) Zic1 and BrdU immunostaining in GNPs from Gnas mutants treated GDC-0449, Rolipram or both and labeled with BrdU for 48 hr. (j) Bar graph depicts the average percentage of BrdU+ cells among Zic1+ GNPs. Experiments were performed three times with at least n = 3 for each treatment. One-way ANOVA with post hoc Newman–Keuls multiple comparison test. **P < 0.01. Scale bars in a-f, 3 μm; c insets, 0.5 μm; i, 30 μm. Representative images and quantifications from at least three independent experiments are shown. Data represent the mean ± SEM. *P < 0.05, **P < 0.01, Student's t-test or one-way ANOVA.
Figure 5
Figure 5. Loss of Gnas in Atoh1+ or Olig1+ progenitors leads to an anatomically distinct Shh-associated MB
(a) A sagittal hindbrain section from a Atoh1:Gnas mouse at P50 was stained with H/E. The boxed area is shown at a high magnification in the right panel. (b) Tumor tissues were immunostained with anti-Tuj1, Olig2, Zic1 and GFAP as indicated. (c) Bar graphs depict expression of Ptch1, Gli1 and Hhip in Atoh1:Gnas cerebella over control at P40. Data represent the mean ± SEM from five animals each group. ** P < 0.01; Student's t test. (d) Olig1 expression (arrow) was detected in the progenitors of the dorsal brainstem at sagittal levels at E15.5 by in situ hybridization. (e) The dorsal brainstem region from Olig1-Cre:Rosa-tdTomato mice at P7 was immunostained with Zic1. Arrows indicates a population of tdTomato+ cells Zic1. (f-g) H/E staining of the sagittal sections of Olig1:Gnas brains at 3 or 5 month ages. Arrows indicate the tumor tissue. Boxed region in f is shown at high magnification in g. BS: brainstem. (h-j) Sections of Olig1:Gnas tumor tissues were immunostained with anti-Ki67, NeuN, Zic1, Pax6 and GFAP as indicated. Scale bars in a, 50 μm. b, 20 μm, d, f, 200 μm; e, 20 μm; g-j, 50 μm.
Figure 6
Figure 6. Tumors in Gnas mutants exhibit a gene expression signature resembling SHH-MB
(a) Heatmap analysis of gene profiling of control cerebella (n = 3) and tumor tissues (n = 8) from Olig1:Gnas mutants by RNA-sequencing shows upregulation of Shh pathway components in tumors. The color bar shows expression intensity. (b) Relative expression of Shh pathway components between control and Olig1:Gnas tumors from four month old animals (n = eight per group) was assayed by qRT-PCR. ** p < 0.01; Student's t test. (c) Regression analysis of gene expression profiles indicates a direct correlation of gene transcription profiles between GFAP:Gnas and Olig1:Gnas tumors (n = eight per group). (d-e) Cross-species comparison of global differential expression from Affymetrix microarray analysis of mouse tumors (n = eight per group) with bona fide human MB subgroups by AGDEX3 R algorithm. Bar graphs represent the cosine similarity measure and reflect the similarity of global expression profile between each mouse tumor subtype and each human MB subgroup. (f) Principal component analysis (PCA) of expression profiles between human and above mouse tumor samples. Arrows indicate that gene expression profiles of mouse tumors match to Shh-subgroup. (g) Subgrouping analysis by nanoString technology indicates the MB from the patient with a GNAS homozygous nonsense mutation resembles a SHH-group tumor with high confidence (PAM prediction score = 0.999996).

References

    1. Taylor MD, et al. Molecular subgroups of medulloblastoma: the current consensus. Acta neuropathologica. 2012;123:465–472. doi:10.1007/s00401-011-0922-z. - PMC - PubMed
    1. Northcott PA, et al. Pediatric and adult sonic hedgehog medulloblastomas are clinically and molecularly distinct. Acta neuropathologica. 2011;122:231–240. doi:10.1007/s00401-011-0846-7. - PMC - PubMed
    1. Grammel D, et al. Sonic hedgehog-associated medulloblastoma arising from the cochlear nuclei of the brainstem. Acta neuropathologica. 2012;123:601–614. doi:10.1007/s00401-012-0961-0. - PubMed
    1. Sasai K, et al. Medulloblastomas derived from Cxcr6 mutant mice respond to treatment with a smoothened inhibitor. Cancer research. 2007;67:3871–3877. - PubMed
    1. Kool M, et al. Genome Sequencing of SHH Medulloblastoma Predicts Genotype-Related Response to Smoothened Inhibition. Cancer cell. 2014;25:393–405. doi:10.1016/j.ccr.2014.02.004. - PMC - PubMed

Publication types

MeSH terms

Associated data