. 2014 Sep;32(9):915-925.
doi: 10.1038/nbt.2972. Epub 2014 Aug 24.

Multi-platform assessment of transcriptome profiling using RNA-seq in the ABRF next-generation sequencing study

Affiliations

Multi-platform assessment of transcriptome profiling using RNA-seq in the ABRF next-generation sequencing study

Sheng Li et al. Nat Biotechnol. 2014 Sep.

Erratum in

  • Nat Biotechnol. 2014 Nov;32(11):1166. Rosenfeld, Jeffrey [corrected to Rosenfeld, Jeffrey A]

Abstract

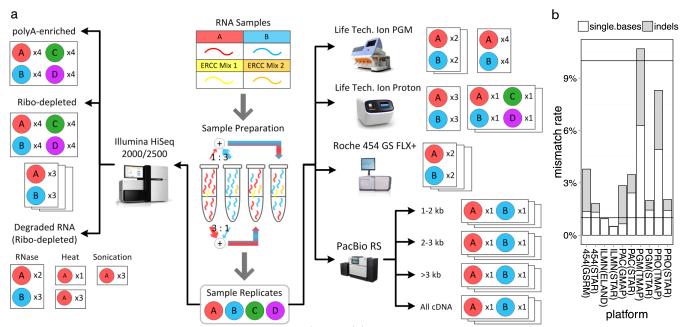
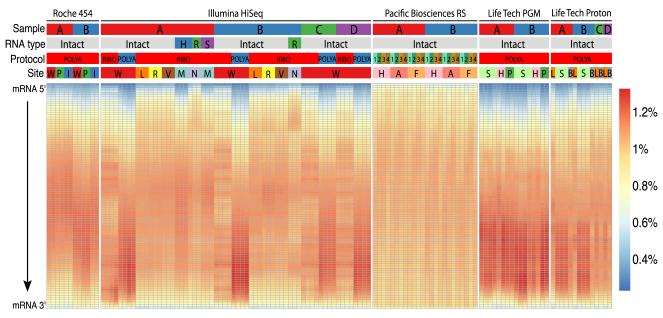
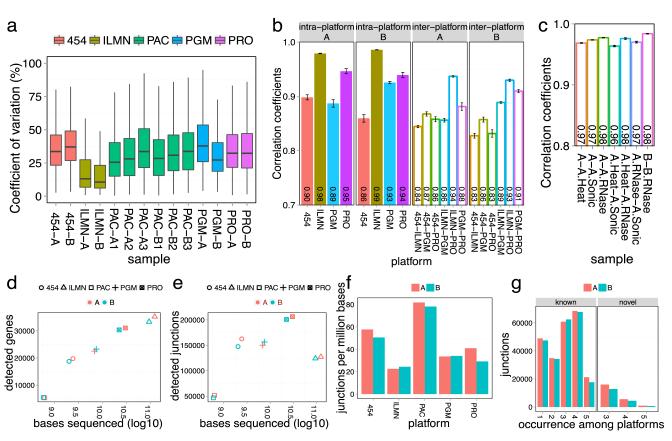
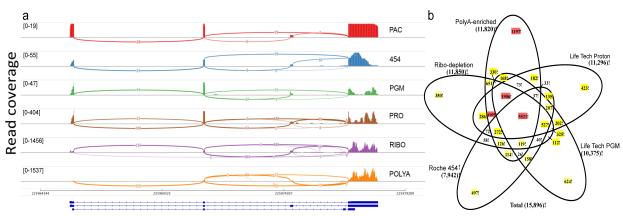
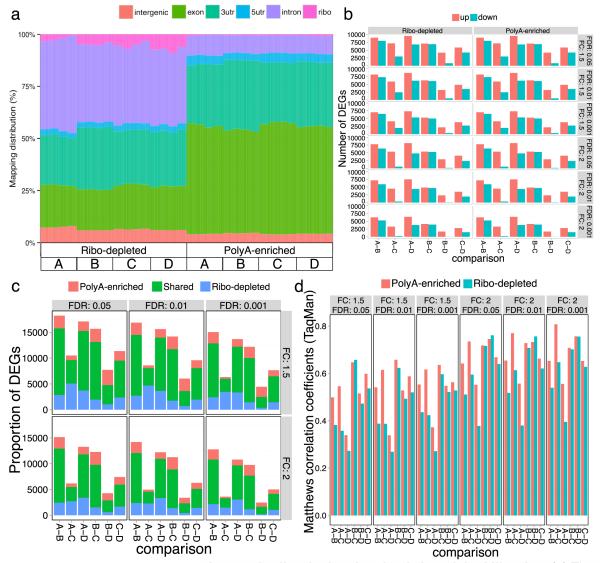
High-throughput RNA sequencing (RNA-seq) greatly expands the potential for genomics discoveries, but the wide variety of platforms, protocols and performance capabilitites has created the need for comprehensive reference data. Here we describe the Association of Biomolecular Resource Facilities next-generation sequencing (ABRF-NGS) study on RNA-seq. We carried out replicate experiments across 15 laboratory sites using reference RNA standards to test four protocols (poly-A-selected, ribo-depleted, size-selected and degraded) on five sequencing platforms (Illumina HiSeq, Life Technologies PGM and Proton, Pacific Biosciences RS and Roche 454). The results show high intraplatform (Spearman rank R > 0.86) and inter-platform (R > 0.83) concordance for expression measures across the deep-count platforms, but highly variable efficiency and cost for splice junction and variant detection between all platforms. For intact RNA, gene expression profiles from rRNA-depletion and poly-A enrichment are similar. In addition, rRNA depletion enables effective analysis of degraded RNA samples. This study provides a broad foundation for cross-platform standardization, evaluation and improvement of RNA-seq.


Figures

Figure 1
Figure 1. Experimental design and sequencing platforms
(a) Two standard RNA samples (A = Universal Human Reference RNA and B = Human Brain Reference RNA) were combined with two sets of synthetic RNAs (ERCCs) to prepare a set of samples to be sequenced on five platforms: Illumina (ILMN) HiSeq 2000/2500, Life Technologies Personal Genome Machine (PGM), Life Technologies Proton (PRO), Pacific Biosciences (PacBio) RS (PAC), and the Roche 454 GS FLX+. Additional RNA samples were also generated: samples C and D were prepared as defined mixtures of A and B, while other aliquots of A and B were degraded by three methods. All these additional samples were ribo-depleted for RNA-seq on the HiSeq platform. The number of technical replicates (x2, x3 or x4) of each sample set is indicated for each platform and method. (b) Stacked bar plots of the sequencing platforms’ mismatch rates (y-axis) for single-base mismatches (white) and insertions/deletions (indels, grey) based on different aligners for each platform (x-axis). Q10 (90% accuracy) and Q20 (99% accuracy) are shown as the top and bottom line, respectively.
Figure 2
Figure 2. Transcript coverage across all genes detected
Each gene was examined as a set of 100 adjacent segments (percentiles of total transcript length). The relative number of reads that map to each segment was then plotted for each sample, platform, and technique (percent of all library reads per segment, see heatmap color key). Samples are categorized by five parameters (top): NGS platforms: Roche 454 GS FLX+, Illumina HiSeq 2000/2500, Pacific Biosciences RS, Life Technologies PGM and Proton; input RNA sample: samples A (red), B (blue), C (green), and D (purple); RNA type: intact or degraded by heat (H, blue), RNase (R, green) or sonication (S, purple); library protocol: polyA enrichment, ribosomal RNA depletion (ribo) or polyA plus 5′ cap enrichment with (1, 2, 3) or without (4) size fractionation; and site: 14 core facility sequencing laboratories. Most platforms showed less coverage at the 5′ and 3′ ends of the transcripts. Details on sequencing platforms, site abbreviations, sample type chemistries, and library preparations are listed in Table 2.
Figure 3
Figure 3. Intra- and inter-platform variation of RNA-seq transcript metrics
The coefficients of variation (CV) of various metrics for transcripts detected across all sites were calculated for the Roche 454 GS FLX+, Illumina HiSeq 2000/2500 (ILMN), Pacific Biosciences RS (PAC), and Life Technologies PGM and Proton (PRO). (a) Inter-site CV of normalized gene expression for transcripts detected across all sites. The median CV for number of genes detected ranged from 10.70-38.68%, with many outlier genes present for each platform. (b) Inter-platform and intra-platform normalized gene expression Spearman correlation coefficients for samples A and B. (c) The degraded RNA profiles match the corresponding intact RNA profiles from HiSeq RNA-seq with very high correlation coefficients (0.975). Error bars are standard error of the mean. (d-e) Sequenced bases (log10) were plotted against the number of detected genes or the number of detected splice junctions for known GENCODE junctions. (f) More efficient splice junction detection (y-axis, number of junctions/Mb of sequence) was observed for long read platforms (PAC, 454). Detection efficiencies were calculated at comparable scales by constraining the total number of bases used from each platform to a range of 630-5451 × 106. (g) Most known junctions were detected by three or more platforms, indicating concordance among RNA-seq methods (left panel). The novel junctions (right) defined by independent observation on three or more platforms were less numerous than known junctions.
Figure 4
Figure 4. Inter-platform consistency of splicing and differential expression analysis
(a) As a representative plot for RNA splicing, transcripts from the SRP9 gene are shown in a sashimi plot across five platforms and two Illumina library protocols. Pacific Biosciences (PAC), Roche 454 (454), and Life Technologies Ion PGM (PGM) detected the two most abundant isoforms. Life Technologies Proton (PRO) and Illumina ribo-depletion (RIBO) or polyA-enriched (POLYA) methods also detected a third isoform. PAC showed more uniform sequencing depth across the gene body. Read coverage as measured by the range of 19-1537 (coverage) is indicated in brackets. (b) Starting from the set of genes detected at any expression level on all platforms, the numbers of A vs. B differentially expressed genes uniquely or repeatedly detected at statistically significant thresholds (FDR <0.05 and fold change >2) are shown; sets of greater than 1000 genes are indicated in red, 100-999 in yellow.
Figure 5
Figure 5. Differentially expressed genes in ribo-depleted and polyA-enriched libraries
(a) The percentage of reads that map to various gene sequence categories was plotted. A greater number of intronic reads from ribo-depleted libraries was observed. The sequence type and read distribution of gene features detected in polyA-enriched and ribo-depleted libraries from the same sample were examined using GENCODE (v12) annotations. Mitochondrial RNA reads are present at trace levels (<0.1%, data not shown). (b) Differentially expressed genes (DEGs) were detected in all pairwise comparisons of the original (A, B) and mixed samples (C, D); (c) results were similar for both library types from the common set of detected genes at all fold-change (FC) and false discovery rate (FDR) thresholds tested. (d) Both library types show similar accuracy as evidenced by Matthews Correlation Coefficients (MCC) with RT-qPCR assays (see Suppl. Fig. 29b for expanded data). A subset of GENCODE mapped reads was used from each library (mean = 37.6 million reads, S.D. = 2.07 million per replicates) to ensure the same number of exon-mapped reads per sample was compared between all replicates.

References

    1. Wang ET, et al. Alternative isoform regulation in human tissue transcriptomes. Nature. 2008;456:470–476. - PMC - PubMed
    1. Nagalakshmi U, Waern K, Snyder M. RNA-Seq: a method for comprehensive transcriptome analysis. Curr Protoc Mol Biol. 2010;11:11–13. Chapter 4, Unit 4. - PubMed
    1. Liu S, Lin L, Jiang P, Wang D, Xing Y. A comparison of RNA-Seq and high-density exon array for detecting differential gene expression between closely related species. Nucleic Acids Res. 2011;39:578–588. - PMC - PubMed
    1. Marioni JC, Mason CE, Mane SM, Stephens M, Gilad Y. RNA-seq: an assessment of technical reproducibility and comparison with gene expression arrays. Genome Res. 2008;18:1509–1517. - PMC - PubMed
    1. Mortazavi A, Williams BA, McCue K, Schaeffer L, Wold B. Mapping and quantifying mammalian transcriptomes by RNA-Seq. Nat. Methods. 2008;5:621–628. - PubMed

Publication types

MeSH terms

Associated data