. 2014 Sep;32(9):896-902.
doi: 10.1038/nbt.2931. Epub 2014 Aug 24.

Normalization of RNA-seq data using factor analysis of control genes or samples

Affiliations

Normalization of RNA-seq data using factor analysis of control genes or samples

Davide Risso et al. Nat Biotechnol. 2014 Sep.

Abstract

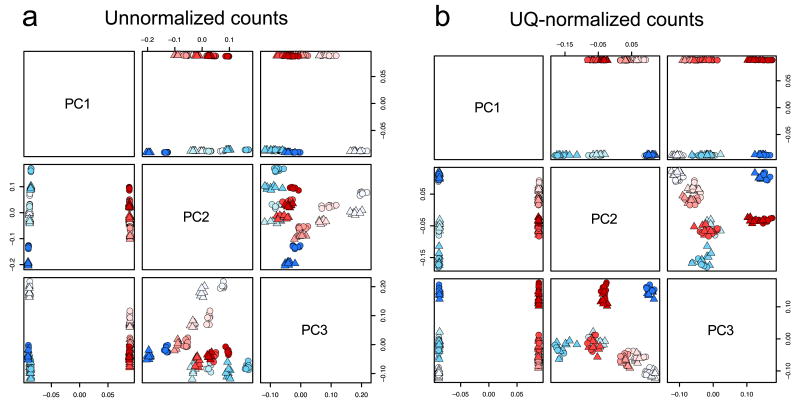
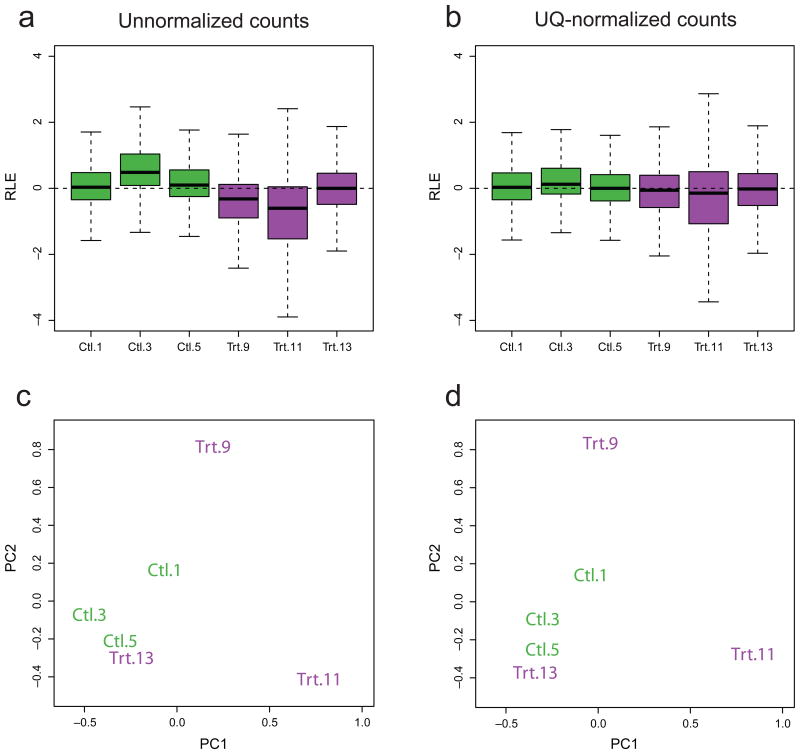
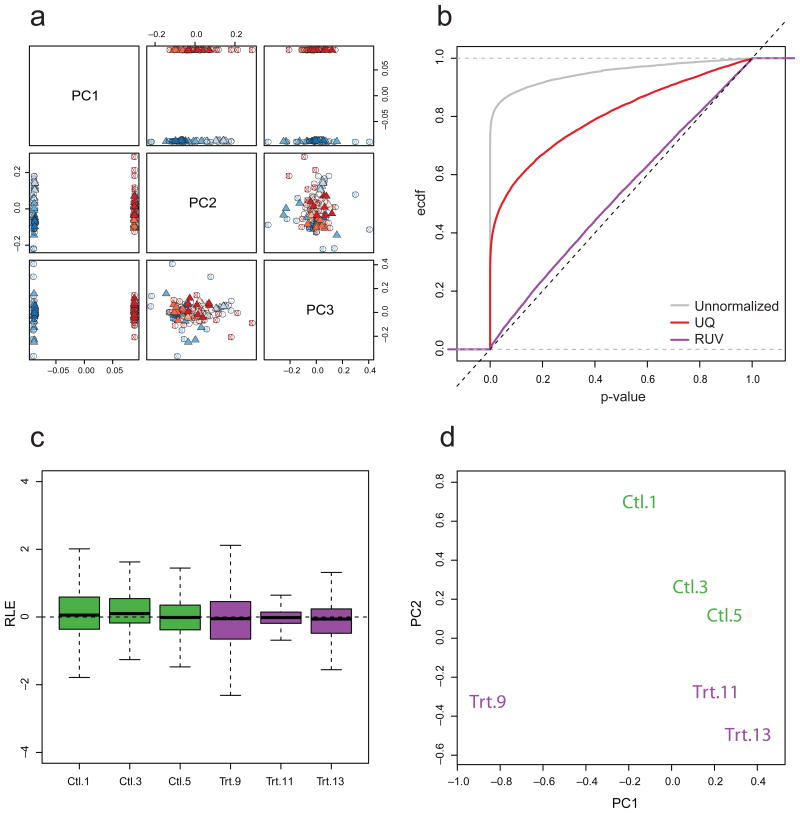
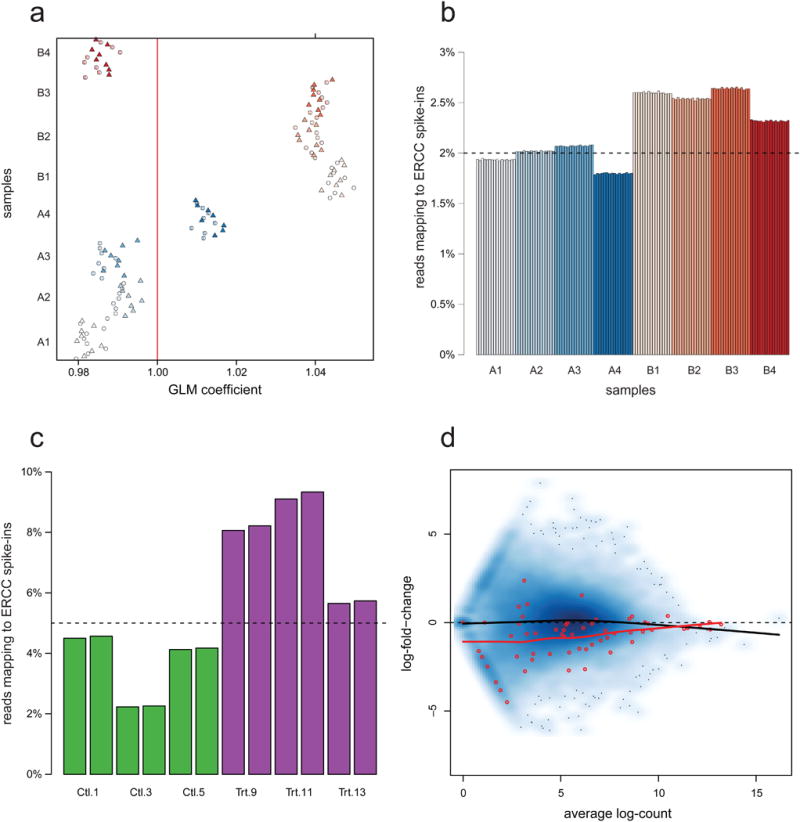
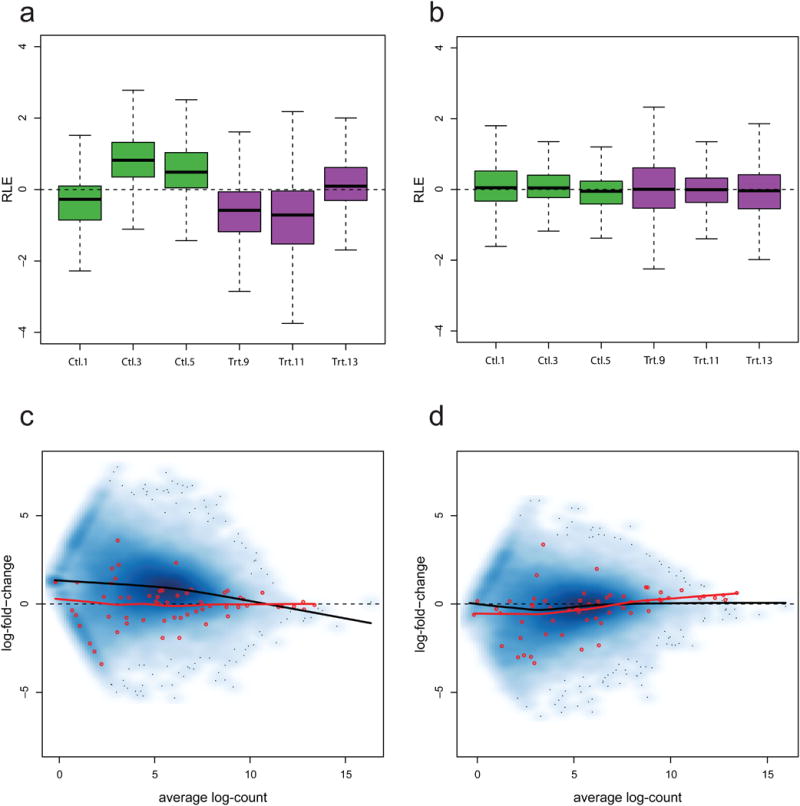
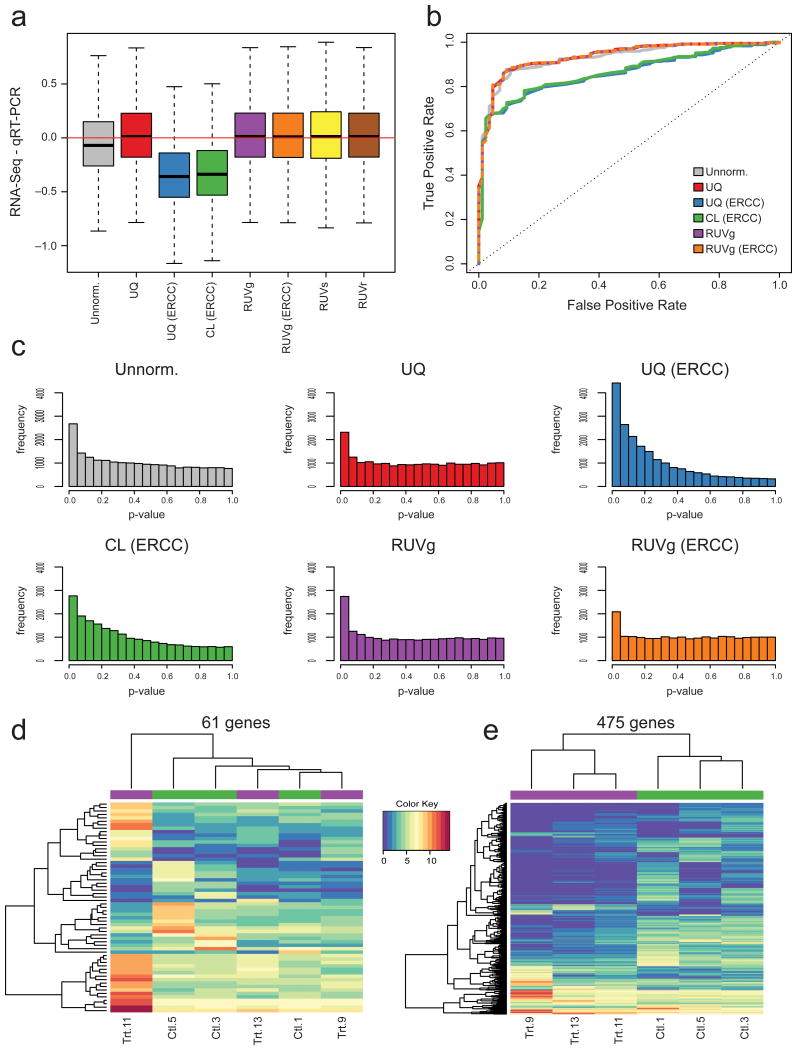
Normalization of RNA-sequencing (RNA-seq) data has proven essential to ensure accurate inference of expression levels. Here, we show that usual normalization approaches mostly account for sequencing depth and fail to correct for library preparation and other more complex unwanted technical effects. We evaluate the performance of the External RNA Control Consortium (ERCC) spike-in controls and investigate the possibility of using them directly for normalization. We show that the spike-ins are not reliable enough to be used in standard global-scaling or regression-based normalization procedures. We propose a normalization strategy, called remove unwanted variation (RUV), that adjusts for nuisance technical effects by performing factor analysis on suitable sets of control genes (e.g., ERCC spike-ins) or samples (e.g., replicate libraries). Our approach leads to more accurate estimates of expression fold-changes and tests of differential expression compared to state-of-the-art normalization methods. In particular, RUV promises to be valuable for large collaborative projects involving multiple laboratories, technicians, and/or sequencing platforms.


Figures

Figure 1
Figure 1
Unwanted variation in S E Q C RNA-seq dataset. (a) Scatterplot matrix of first three principal components (PC) for unnormalized counts (log scale, centered). The PCs are orthogonal linear combinations of the original 21,559-dimensional gene expression profiles, with successively maximal variance across the 128 samples, i.e., the first PC is the weighted average of the 21,559 gene expression measures that provides the most separation between the 128 samples. Each point corresponds to one of the 128 samples. The four Sample A and the four Sample B libraries are represented by shades of blue and red, respectively (16 replicates per library). Circles and triangles represent samples sequenced in the first and second flow-cells, respectively. As expected for the SEQC dataset, the first PC is driven by the extreme biological difference between Sample A and Sample B. The second and third PCs clearly show library preparation effects (the samples cluster by shade) and, to a lesser extent, flow-cell effects reflecting differences in sequencing depths (within each shade, the samples cluster by shape). (b) Same as a, for upper quartile(UQ)–normalized counts. UQ normalization removes flow-cell effects (the circles and triangles now cluster together), but not library preparation effects. All other normalization procedures but RUV behave similarly as UQ (Supplementary Fig. 1).
Figure 2
Figure 2
Unwanted variation in Zebrafish RNA-seq dataset. (a) Boxplots of relative log expression (RLE) for unnormalized counts. Purple, treated libraries (Trt); green, control libraries (Ctl). We expect RLE distributions to be centered around zero and as similar as possible to each other. The RLE boxplots clearly show the need for normalization. (b) Same as a, for UQnormalized counts. UQ normalization centers RLE around zero, but fails to remove the excessive variability of Library 11. (c) Scatterplot of first two PCs for unnormalized counts (log scale, centered). Libraries do not cluster as expected according to treatment. (d) Same as c, for UQ-normalized counts. UQ normalization does not lead to better clustering of the samples. All other normalization procedures but RUV behave similarly as UQ (Supplementary Figs. 2 and 3).
Figure 3
Figure 3
RUVg normalization using in silico empirical control genes. (a) For SEQC dataset, scatterplot matrix of first three PCs after RUVg normalization (log scale, centered). RUVg adjusts for library preparation effects (cf. Fig. 1), while retaining the Sample A vs. B difference. (b) For SEQC dataset, empirical cumulative distribution function (ECDF) of p-values for tests of DE between Sample A replicates (given a value x, the ECDF at x is simply defined as the proportion of p-values less than or equal to x). We expect no DE and p-values to follow a uniform distribution, with ECDF as close as possible to the identity line. This is clearly not the case for unnormalized (gray line) and UQ-normalized (red) counts; only with RUVg (purple) do p-values behave as expected. (c) For Zebrafish dataset, boxplots of RLE for RUVg-normalized counts. RUVg shrinks the expression measures for Library 11 towards the median across libraries, suggesting robustness against outliers. (d) For Zebrafish dataset, scatterplot of first two PCs for RUVg-normalized counts (log scale, centered). Libraries cluster as expected by treatment.
Figure 4
Figure 4
Behavior of the ERCC spike-in controls. (a) For SEQC dataset, generalized linear model (GLM) regression coefficients of spike-in read counts on nominal concentrations. Each point corresponds to one of the 128 samples. The four Sample A and the four Sample B libraries are represented by shades of blue and red, respectively (16 replicates per library). Circles and triangles represent samples sequenced in the first and second flow-cells, respectively. There are evident library preparation effects. (b) For SEQC dataset, proportion of reads mapping to spike-ins deviates markedly from nominal value (dashed line). There are library preparation effects and troubling Sample A vs. B effects which may bias the inference of DE. (c) For Zebrafish dataset, proportion of reads mapping to spike-ins deviates markedly from nominal value (dashed line). Again, there are library preparation and treatment effects (control: Ctl, green; treated: Trt, purple). (d) For Zebrafish dataset, mean-difference plot (MD-plot) of unnormalized counts (log scale) for two control samples (Library 5 vs. Library 1). The blue shading represents point density and spike-ins are plotted using red points. The lines are the lowess fits for genes (black) and spike-ins (red). As expected, log-fold-changes are scattered around the horizontal zero line, indicating that most genes are equally expressed in the two control samples. The negative slope of the black line suggests the need for normalization. The difference between the two lowess fits indicates that, disturbingly, the spike-ins do not behave as the bulk of the genes.
Figure 5
Figure 5
Using the ERCC spike-in controls for normalization, Zebrafish dataset. (a) Boxplots of RLE for cyclic-loess(CL)-normalized counts for control (Ctl, green) and treated (Trt, purple) samples. The expression measures are clearly not comparable across replicate libraries and CL based on the spike-ins is not effective at normalizing the counts. (b) Boxplots of RLE for RUVgnormalized counts. RUVg based on the spike-ins leads to much more reasonable RLE distributions, similar to those obtained using a set of empirical controls (Fig. 3c). (c) MD-plot for CL-normalized counts (log scale) for the same control samples as in Figure 4c. By shifting the spike-in log-fold-changes towards zero, CL normalization leads to a global shift of the gene log-fold-changes away from zero. For control samples, with no expected DE, CL normalization is likely to bias expression measures. (d) MD-plot for RUVg-normalized counts (log scale) for the same control samples as in Figure 4c. Log-fold-changes for both the spike-ins and the genes are scattered around the zero line, yielding more realistic expression measures than CL normalization.
Figure 6
Figure 6
Impact of normalization on differential expression analysis. (a) For SEQC dataset, difference between RNA-seq and qRT-PCR estimates of Sample A/Sample B log-fold-changes, i.e., bias in RNA-seq when viewing qRT-PCR as gold standard. All RUV versions lead to unbiased log-fold-change estimates; CL based on ERCC spike-ins leads to severe bias. (b) For SEQC dataset, receiver operating characteristic (ROC) curves using a set of 370 positive and 86 negative qRT-PCR controls as gold standard. RUVg (based on either empirical or spike-in controls) and UQ normalization perform slightly better than no normalization. UQ based on spike-ins performs similarly to no normalization and CL based on spike-ins performs the worst. (c) For Zebrafish dataset, distribution of edgeR p-values for tests of DE between treated and control samples. UQ and CL normalization based on spike-ins lead to distributions far from the expected uniform. (d) For Zebrafish dataset, heatmap of expression measures for the 61 genes found DE between control (Ctl) and treated (Trt) samples after UQ but not after RUVg normalization. Clustering of samples is driven by outlying Library 11. (e) Heatmap of expression measures for the 475 genes found DE after RUVg but not after UQ normalization. Samples cluster as expected by treatment.

References

    1. Bullard J, Purdom E, Hansen K, Dudoit S. Evaluation of statistical methods for normalization and differential expression in mRNA-Seq experiments. BMC Bioinformatics. 2010;11:94. - PMC - PubMed
    1. Risso D, Schwartz K, Sherlock G, Dudoit S. GC-content normalization for RNA-Seq data. BMC Bioinformatics. 2011;12:480. - PMC - PubMed
    1. Dillies MA, et al. A comprehensive evaluation of normalization methods for Illumina high-throughput RNA sequencing data analysis. Briefings in Bioinformatics. 2013;14:671–683. - PubMed
    1. Robinson MD, Oshlack A. A scaling normalization method for differential expression analysis of RNA-seq data. Genome Biology. 2010;11:R25. - PMC - PubMed
    1. Hansen KD, Irizarry RA, Zhijin W. Removing technical variability in RNA-seq data using conditional quantile normalization. Biostatistics. 2012;13:204–216. - PMC - PubMed

Publication types

MeSH terms

Associated data