. 2014 Sep;21(9):833-9.
doi: 10.1038/nsmb.2876. Epub 2014 Aug 24.

Asymmetric mRNA localization contributes to fidelity and sensitivity of spatially localized systems

Affiliations

Asymmetric mRNA localization contributes to fidelity and sensitivity of spatially localized systems

Robert J Weatheritt et al. Nat Struct Mol Biol. 2014 Sep.

Abstract

Although many proteins are localized after translation, asymmetric protein distribution is also achieved by translation after mRNA localization. Why are certain mRNA transported to a distal location and translated on-site? Here we undertake a systematic, genome-scale study of asymmetrically distributed protein and mRNA in mammalian cells. Our findings suggest that asymmetric protein distribution by mRNA localization enhances interaction fidelity and signaling sensitivity. Proteins synthesized at distal locations frequently contain intrinsically disordered segments. These regions are generally rich in assembly-promoting modules and are often regulated by post-translational modifications. Such proteins are tightly regulated but display distinct temporal dynamics upon stimulation with growth factors. Thus, proteins synthesized on-site may rapidly alter proteome composition and act as dynamically regulated scaffolds to promote the formation of reversible cellular assemblies. Our observations are consistent across multiple mammalian species, cell types and developmental stages, suggesting that localized translation is a recurring feature of cell signaling and regulation.


Figures

Figure 1
Figure 1. Classification and characterization of the Transport After Synthesis (TAS) and Distal Site Synthesis (DSS) group of proteins
a, The two major mechanisms for localizing proteins to distal sites in the cell. b, Datasets used to identify groups of DSS and TAS transcripts (M1 and mP2, respectively), as well as DSS and TAS proteins (pM1 and P2, respectively) in mouse neuroblastoma cells (N1E-115 neuronal-like cells), fibroblast-like pseudopodia (COS-7 and NIH3T3 cells, respectively) and rat sensory neurons. For the fibroblast-like cells dataset, mouse genes that are one-to-one orthologs to the primate genes identified in the COS-7 cell line were used in the study (please see Supplementary note about the validity of this approach). All mRNA identified by microarray analysis are assumed to be translated locally at some point in the lifetime of the cell (pM1). This list of proteins is subtracted from the asymmetrically localized protein dataset (P1) to obtain the transport after synthesis (TAS) group of proteins (P2). The transcripts that are asymmetrically localized (M1) are subtracted from the transcripts whose proteins are asymmetrically localized (mP1) to obtain the transcripts whose protein products are transported after synthesis (mP2) (see Online Methods). c, The genome-scale datasets used to investigate the differences between the DSS and TAS groups of proteins (see Supplementary Data Table 1). d. An illustration of the concept of asymmetric localization of proteins and mRNA. It is important to note that in neurons, protein transport can take hours or even days to transport proteins between locations,.
Figure 2
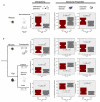
Figure 2. Structural analysis of Distal Site Synthesis Proteins reveals an enrichment in disordered regions
(a, b) Graphs and boxplots of the distribution of the various structural properties of the distal site synthesis (DSS) (red plots) and transport after synthesis (TAS) (grey plots) proteins of the mouse neuroblastoma datasets (a), the mouse pseudopodia, the rat embryonic sensory neuron dataset and the adult sensory neuron dataset (b). Statistical significance was assessed using the one-tailed Wilcoxon-rank sum test for comparing distributions and the one-tailed Fishers-exact test for comparing enrichments with a false-discovery rate correction for multiple testing. See individual plots for p-values and each row for respective samples size. The effect size is displayed for each boxplot with a common language metric and Cohen’s U3-, D- and Odd-ratio (OR)-statistic (see Online Methods). For example, the common language metric describes “the probability that a score sampled at random from distribution A will be greater than a score sampled from distribution B”. The median value for each group of proteins is shown with a horizontal black line. Boxes enclose values between the first and third quartile. Interquartile range is calculated by subtracting the first quartile from the third quartile. All values outside this range are considered to be outliers and were removed from the graphs to improve visualization. The smallest and highest values that are not outliers are connected with the dashed line. The notches correspond to ~95% confidence interval for the median.
Figure 3
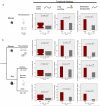
Figure 3. Analysis of Distal Site Synthesis Proteins reveals an enrichment for linear motifs, phase-transition (i.e. higher order assembly) promoting segments and PTM sites that act as molecular switches
(a, b) Graphs and boxplots of the distribution of the various regulatory and structural properties of the distal site synthesis (DSS) (red plots) and transport after synthesis (TAS) (grey plots) proteins of the mouse neuroblastoma datasets (a), the mouse pseudopodia, the rat embryonic sensory neuron dataset and the adult sensory neuron dataset (b). The effect size is displayed for each boxplot with a common language metric and Cohen’s U3 statistic. See Figure 2 and Online Methods for description of boxplots and statistical tests used.
Figure 4
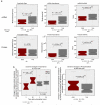
Figure 4. Dynamic regulation of Distal Site Synthesis transcripts and proteins
a, Boxplot comparing the genome-wide quantitative measurements of gene expression of DSS (red) and TAS (grey) proteins in mouse fibroblast cells. DSS transcripts and proteins have a lower abundance and shorter half-lives suggesting tighter temporal regulation of distal site synthesis transcripts and proteins. b, Changes in the abundance of TAS and DSS proteins at 5 and 30 minutes compared to 0 minutes and 5 minutes, respectively, after activation of the extracellular signal-related kinase (ERK) pathway (data from von Kriegsheim et al). DSS proteins have a significant increase in abundance between 5th and 30th minute after stimulation possibly associated with rapid protein synthesis due to decentralized gene expression. c, The HEK-293 cells at 3 and 15 minutes (samples merged) after stimulation with angiotensin were compared to the control sample (0 minutes), as calculated in the original paper. A relative increase in the abundance of regulated phosphopeptides in the DSS group of proteins is observed between the control sample and the stimulated samples, as compared to TAS proteins (see Online Methods for details). Only regulated phosphopeptides samples (2 fold change) were included in the analysis. The effect size is displayed for each boxplot with a common language metric and Cohen’s U3 statistic. See Figure 2 and Online Methods for description of boxplots and statistical tests used.
Figure 5
Figure 5. An overview of the potential advantages conferred by distal site protein synthesis
An overview of the key inferences from our analysis. Turquoise and red filled circle represents off-target and correct interaction partners, respectively. Wavy lines represent a disordered region within a distal site synthesis protein. Grey and red line in graphs represents profiles of the transport after synthesis and distal site synthesis group of proteins, respectively.

Similar articles

Cited by

References

    1. Martin KC, Ephrussi A. mRNA localization: gene expression in the spatial dimension. Cell. 2009;136:719–730. - PMC - PubMed
    1. Scott JD, Pawson T. Cell signaling in space and time: where proteins come together and when they’re apart. Science. 2009;326:1220–1224. - PMC - PubMed
    1. Ephrussi A, Dickinson LK, Lehmann R. Oskar organizes the germ plasm and directs localization of the posterior determinant nanos. Cell. 1991;66:37–50. - PubMed
    1. Holt CE, Bullock SL. Subcellular mRNA localization in animal cells and why it matters. Science. 2009;326:1212–1216. - PMC - PubMed
    1. Jung H, Gkogkas CG, Sonenberg N, Holt CE. Remote Control of Gene Function by Local Translation. Cell. 2014;157(1):26–40. - PMC - PubMed

Reference for Online Methods

    1. Han TW, et al. Cell-free formation of RNA granules: bound RNAs identify features and components of cellular assemblies. Cell. 2012;149:768–779. - PubMed
    1. Ostlund G, et al. InParanoid 7: new algorithms and tools for eukaryotic orthology analysis. Nucleic Acids Res. 2010;38:D196–D203. - PMC - PubMed
    1. Schwanhausser B, et al. Corrigendum: Global quantification of mammalian gene expression control. Nature. 2013;495:126–127. - PubMed
    1. Kinsella RJ, et al. Ensembl BioMarts: a hub for data retrieval across taxonomic space. Database. 2011;2011:bar030. - PMC - PubMed
    1. Dennis GJ, et al. DAVID: Database for Annotation, Visualization, and Integrated Discovery. Genome Biol. 2003;4:P3. - PubMed

Publication types