Review
. 2014 Dec;1840(12):3460-3474.
doi: 10.1016/j.bbagen.2014.08.007. Epub 2014 Aug 20.

The utility of metabolomics in natural product and biomarker characterization

Affiliations
Review

The utility of metabolomics in natural product and biomarker characterization

Daniel G Cox et al. Biochim Biophys Acta. 2014 Dec.

Abstract

Background: Metabolomics is a well-established rapidly developing research field involving quantitative and qualitative metabolite assessment within biological systems. Recent improvements in metabolomics technologies reveal the unequivocal value of metabolomics tools in natural products discovery, gene-function analysis, systems biology and diagnostic platforms.

Scope of review: We review here some of the prominent metabolomics methodologies employed in data acquisition and analysis of natural products and disease-related biomarkers.

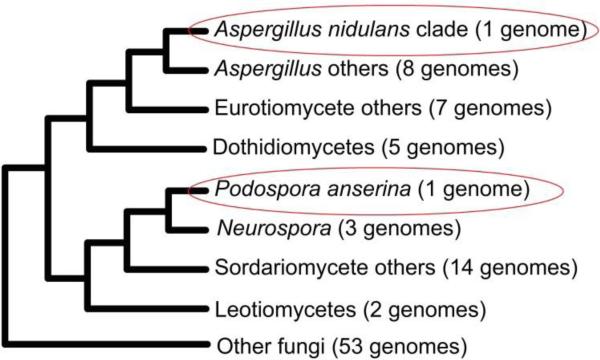
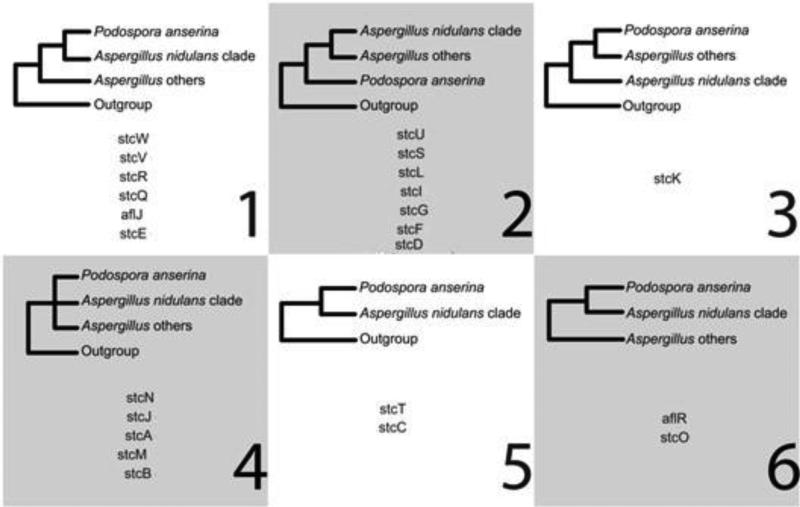
Major conclusions: This review demonstrates that metabolomics represents a highly adaptable technology with diverse applications ranging from environmental toxicology to disease diagnosis. Metabolomic analysis is shown to provide a unique snapshot of the functional genetic status of an organism by examining its biochemical profile, with relevance toward resolving phylogenetic associations involving horizontal gene transfer and distinguishing subgroups of genera possessing high genetic homology, as well as an increasing role in both elucidating biosynthetic transformations of natural products and detecting preclinical biomarkers of numerous disease states.

General significance: This review expands the interest in multiplatform combinatorial metabolomic analysis. The applications reviewed range from phylogenetic assignment, biosynthetic transformations of natural products, and the detection of preclinical biomarkers.

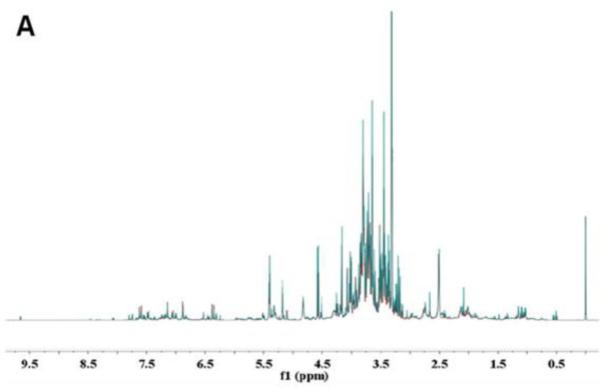
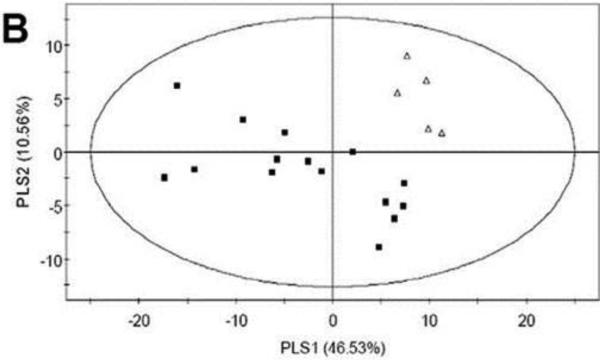
Keywords: Diagnostic biomarker; Integrated approach; NMR; PCA; Plant metabolomics; Targeted metabolomics.


Figures

Fig. 1
Fig. 1
Relative ionization capabilities of APCI, APPI, and ESI sources. Figure obtained/modified from reference [31]. Permission pending.
Fig. 2
Fig. 2
System level metabolite analysis by capillary-RPLC-IT-TOF-MS/MS of S. oneidensis, >5000 metabolites detected, 100-1500 m/z scan range. Figure obtained/modified from reference [29]. Permission pending.
Fig. 3
Fig. 3
A: the Wilkoxon rank sum tests of 7-day LMC group (top) and 3-day LC group (bottom) were performed. The x and y axes represent the ppm axis, and the log of 1-P values, respectively. Values with. P values smaller than 0.01 are shown as blue dots. B: Marker metabolites profile for the LMC group. The actual levels of the LC marker metabolites are exhibited with corresponding peaks. Blue-normal; green- 3-day LMC; red-7-day LMC. Figure obtained from reference [42]. Permission pending.
Fig. 4
Fig. 4
(A) OSC-PLS-DA score plot, and (B) Monte Carlo Cross Validation (MCCV) prediction results of the PLSDA model plotted as sensitivity vs 1-specificity utilizing the 1H NMR spectra of samples from 42 control dogs and 40 dogs with TCC. Figure obtained from reference [46]. Permission pending.
Fig. 5
Fig. 5
A: 1H-NMR spectra of the co-overexpressing transgenic plant (in green) and control (in red) lines. B: Score plot of PLS-DA of the co-overexpressing transgenic plant (Δ) and control (■) lines. Figure obtained from reference [55]. Permission pending.
Fig. 5
Fig. 5
A: 1H-NMR spectra of the co-overexpressing transgenic plant (in green) and control (in red) lines. B: Score plot of PLS-DA of the co-overexpressing transgenic plant (Δ) and control (■) lines. Figure obtained from reference [55]. Permission pending.
Fig. 6
Fig. 6
Genomic phylogenies of evaluated fungal species. Figure obtained/modified from reference [64]. Permission pending.
Fig. 7
Fig. 7
Cluster gene supported phylogenies. Figure obtained/modified from reference [64]. Permission pending
Fig. 8
Fig. 8
MALDI-TOF-MS fingerprint analysis of Pseudoalteromonas sp. and Alteromonas sp. Figure obtained/modified from [65]. Permission pending.
Fig. 9
Fig. 9
(a) Principal coordinate analysis scatterplot of metabolites from Pseudoalteromonas sp. detected by MALDI-TOF-MS. (b) 16S rDNA based phylogenetic tree of Pseudoalteromonas sp. Figure was obtained/modified from [65]. Permission Pending
Fig. 10
Fig. 10
Score plot based on (A) RPLC data, (B) HILIC data, and (C) combined data sets (■ renal cell carcinoma patients, ▲ control patients). (D) Staging of patient renal cell carcinoma from combined RPLC/HILLIC-MS data. (▲control patients, ● T1-T2 stage, ■ T3-4 stage). Figure obtained/modified from reference [82]. Permission pending.
Fig. 11
Fig. 11
CE-TOF-MS profile of salivary metabolites from patients with oral cancer (n = 69) and control samples (n = 87). X axis is migration time and Y axis is m/z. Circled peaks are significantly different (p < 0.05) between the two groups. Red corresponds to oral cancer group and blue to control. Figure obtained/modified from reference [83]. Permission pending.
Fig. 12
Fig. 12
Heat-map of 57 tentative biomarker candidate peaks from 215 patients (control = 85, disease = 128) saliva samples. Columns represent individual patient and rows specific metabolite. Figure obtained/modified from reference [83]. Permission pending.
Fig. 13
Fig. 13
Isolate de-replication by metabolomic analysis. (a) LC-MS-PCA score plot of 47 strains. (b) Heat-map illustrating metabolic profiles of clusters from PCA, groups 1-7. (c) Phylogenetic tree of strains, colors correspond to metabolomic profiles. Streptomyces sp. (WMMB-328) used as an outgroup. Figure obtained/modified from reference [95]. Permission pending.
Fig. 14
Fig. 14
Schematic representation of the pyruvate-metabolic pathways in S. aureus. Figure obtained/modified from reference [96]. Permission pending.
Fig. 15
Fig. 15
Representative network map where nodes are based on spectral similarity. Figure obtained/modified from reference [97]. Permission pending.
Fig. 16
Fig. 16
Role of network analysis in systems approach to drug discovery. Figure obtained/modified from reference [40]. Permission pending.
Fig. 17
Fig. 17
Structures of didemnins with side-chain differences from didemnin B noted in red. Figure obtained/modified from reference [98]. Permission pending.

References

    1. Manson JE, Colditz GA, Stampfer MJ, Willett WC, Rosner B, Monson RR, Speizer FE, Hennekens CH. A prospective study of obesity and risk of coronary heart disease in women. N. Engl. J. Med. 1990;322:882–889. - PubMed
    1. Hinton D, Bacon C. The distribution and ultrastructure of the endophyte of toxic tall fescue. Can. J. Bot. 1985;63:36–42.
    1. Tyree M, Cheung Y, MacGregor M, Talbot A. The characteristics of seasonal and ontogenetic changes in the tissue-water relations of Acer, Populus, Tsuga, and Picea. Can. J. Bot. 1978;56:635–647.
    1. Dudley E, Yousef M, Wang Y, Griffiths W. Targeted metabolomics and mass spectrometry. Adv. Protein Chem. Struct. Biol. 2010;80:45–83. - PubMed
    1. Patti GJ, Yanes O, Siuzdak G. Innovation: Metabolomics: the apogee of the omics trilogy. Nat. Rev. Mol. Cell Biol. 2012;13:263–269. - PMC - PubMed

LinkOut - more resources