. 2014 Oct;17(10):1388-94.
doi: 10.1038/nn.3794. Epub 2014 Aug 24.

Image familiarization sharpens response dynamics of neurons in inferotemporal cortex

Affiliations

Image familiarization sharpens response dynamics of neurons in inferotemporal cortex

Travis Meyer et al. Nat Neurosci. 2014 Oct.

Abstract

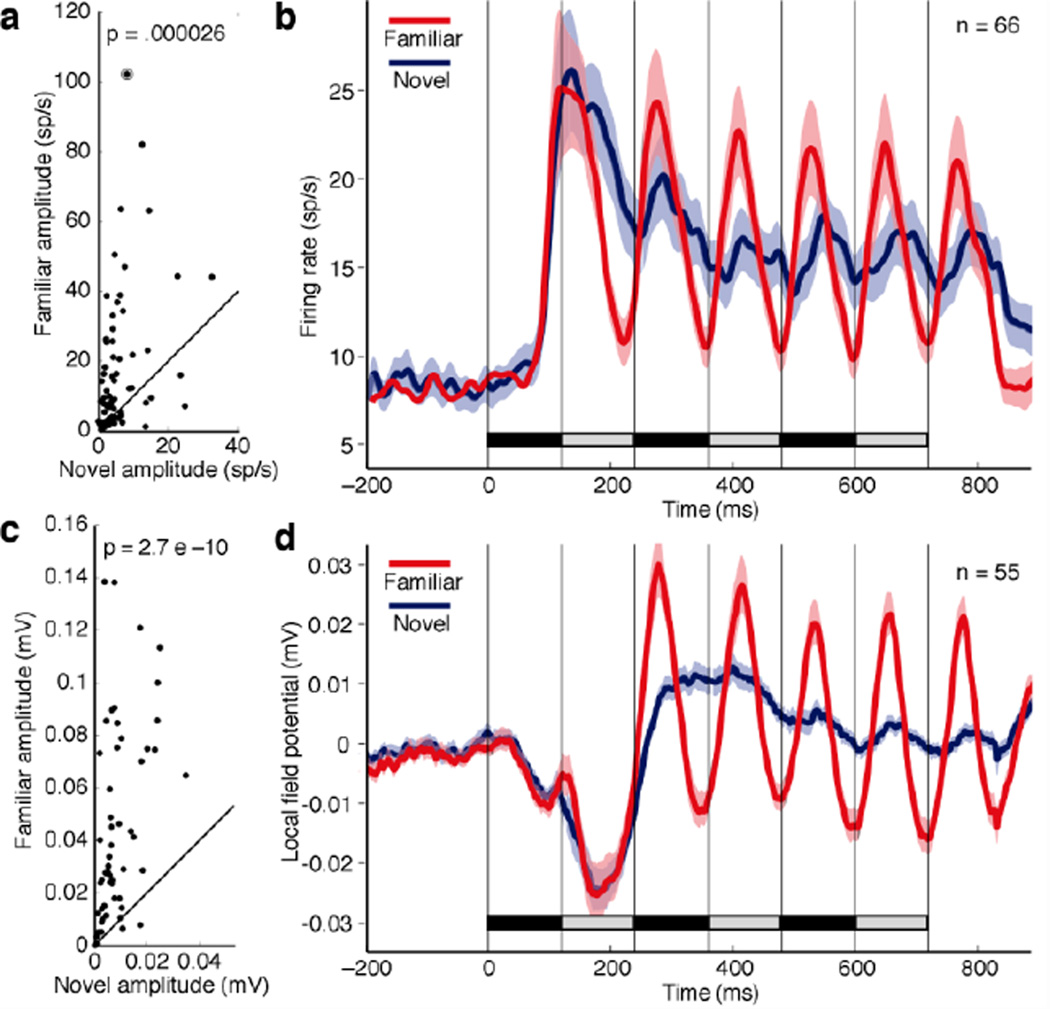
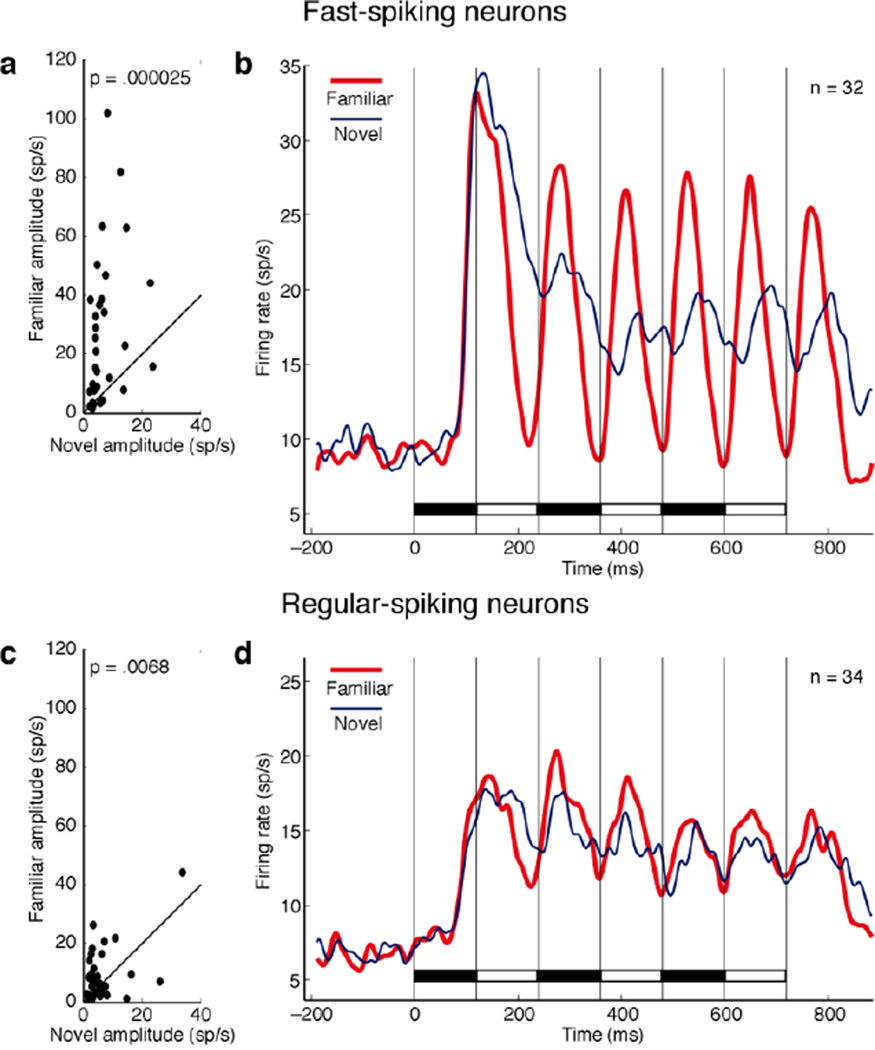
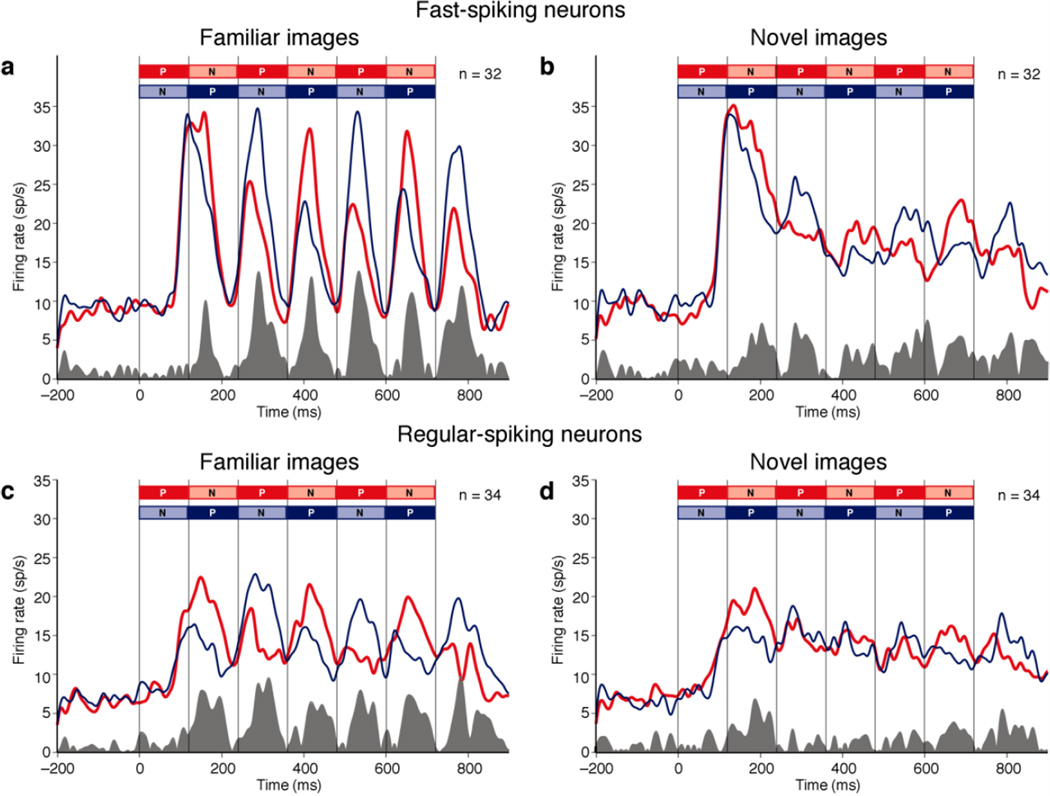
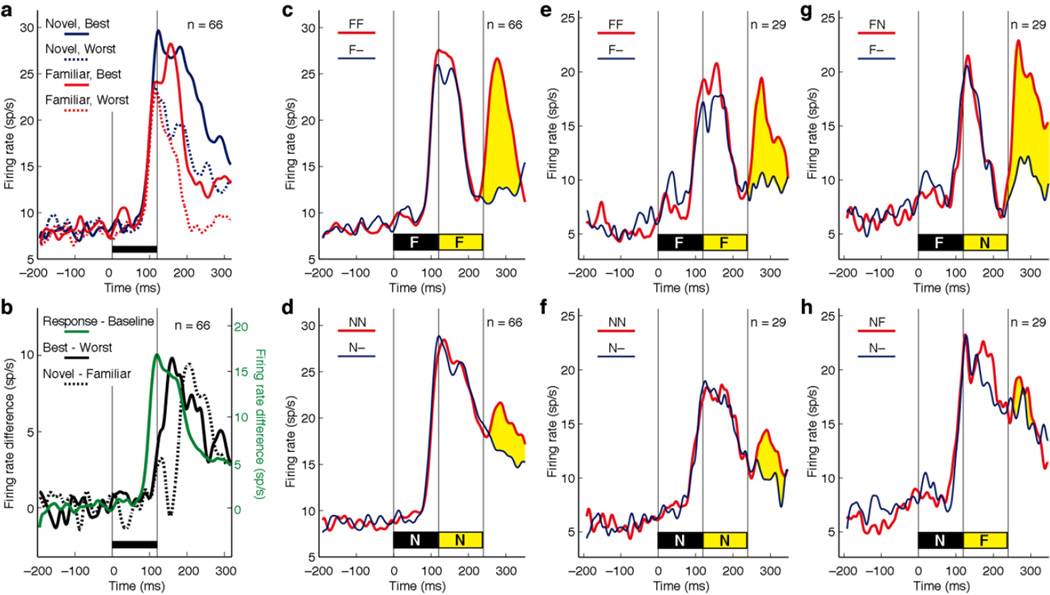
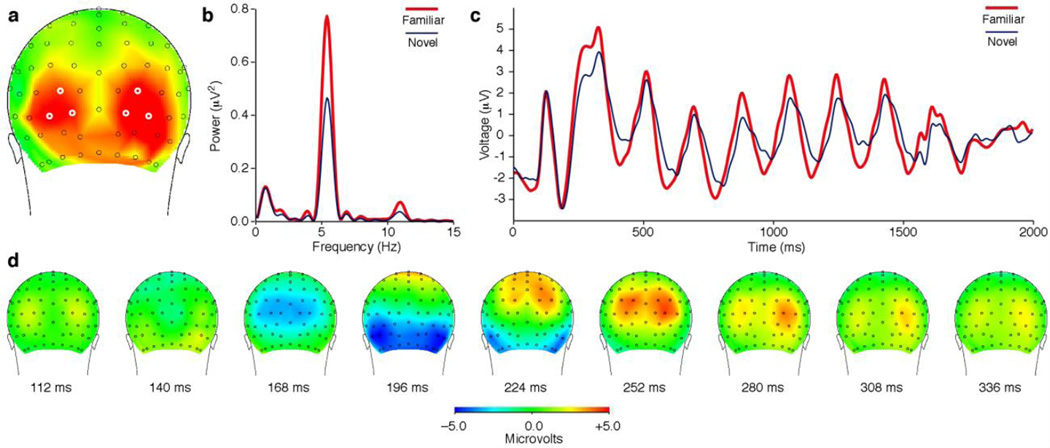
Repeated viewing of an image over days and weeks induces a marked reduction in the strength with which neurons in monkey inferotemporal cortex respond to it. The processing advantage that attaches to this reduction is unknown. One possibility is that truncation of the response to a familiar image leaves neurons in a state of readiness to respond to ensuing images and thereby enhances their ability to track rapidly changing displays. We explored this possibility by assessing neuronal responses to familiar and novel images in rapid serial visual displays. Inferotemporal neurons responded more strongly to familiar than to novel images in such displays. The effect was stronger among putative inhibitory neurons than among putative excitatory neurons. A comparable effect occurred at the level of the scalp potential in humans. We conclude that long-term familiarization sharpens the response dynamics of neurons in both monkey and human extrastriate visual cortex.


Figures

Figure 1
Figure 1. Training and testing procedures
(a) Sixteen images rendered familiar by repeated viewing over the course of a month in monkey 1. The exposure set for monkey 2 consisted of other background-free object images. (b) On each exposure trial during the familiarization period, the monkey maintained fixation at the center of the screen for 1600 ms. During fixation, a single image was presented for 1000 ms at the fovea. Fluid reward was delivered at the end of each trial contingent solely on the monkey’s having maintained fixation. (c) Procedure for rapid serial visual presentation during neuronal recording. On each trial, the monkey maintained central fixation while two images were presented in alternation at the fovea. The images could be both familiar (F1 and F2) or both novel (N1 and N2). (d–i) Data from a neuron giving strong periodic responses to rapidly alternating familiar images but not to rapidly alternating novel images. Successive displays in the left column show the responses of a representative neuron to familiar images presented in the sequence F1F2 (d) or F2F1 (e) and in data combined from the two sequences (f). Successive displays in the right column show responses of the same neuron to novel images presented in the sequence N1N2 (g) or N2N1 (h) and in data combined from the two sequences (i).
Figure 2
Figure 2. Rapid sequences of familiar images elicit stronger periodic responses than rapid sequences of novel images
(a) For each of 66 neurons, the amplitude of the periodic response elicited by a familiar string is plotted against the amplitude of the periodic response elicited by a novel string. Amplitude was measured during the 700 ms window indicated by the black bars in Fig’s 1f and 1i. The circled point is from the example neuron of Fig. 1d–i. The p indicates the outcome of a paired t-test on the 66 pairs of values. (b) Mean across 66 neurons of the firing rate elicited under familiar-image (red) and novel-image (blue) conditions. (c) For each of 55 LFP sites, the amplitude of the periodic response elicited by a familiar string is plotted against the amplitude of the periodic response elicited by a novel string. (d) Mean across 55 LFP sites of the voltage elicited under familiar-image (red) and novel-image (blue) conditions. Ribbons in (b) and (d) indicate standard error of the mean.
Figure 3
Figure 3. The tendency for familiar images to elicit strong periodic responses is more prominent among fast-spiking (putative inhibitory) than among regular-spiking (putative excitatory) neurons
(a–b) Data from 32 fast-spiking neurons. (c–d) Data from 34 regular-spiking neurons. Conventions as in Fig. 2a. For criteria on the basis of which neurons were classified, see Supplementary Fig. 4.
Figure 4
Figure 4. During rapid sequential presentation, neurons represent familiar-image identity more strongly than novel-image identity
In each panel, the red curve represents the mean firing rate elicited by strings in which the preferred image (P) led and the blue curve represents the mean of the firing rate on trials in which the non-preferred image (N) led. The shaded histogram at the base of each panel represents the absolute difference between the red and blue curves and thus is a measure of image-selective activity.
Figure 5
Figure 5. Truncation of the response to a familiar image is accompanied by enhanced responsiveness to an immediately ensuing image
(a) The population response to a familiar image is truncated shortly after it begins. Firing rate of 66 recorded neurons is represented as a function of time following image onset. The black bar above the time line indicates the 120 ms duration of the image. Firing is represented independently for trials involving the preferred novel image (solid blue), the non-preferred novel image (dashed blue), the preferred familiar image (solid red) and the non-preferred familiar image (dashed red). (b) Difference curves representing the following signals. Visual response: mean firing rate for all images minus time-zero baseline (solid green; scale to right). Image discrimination: firing rate for preferred images minus firing rate for non-preferred images (solid black; scale to left). Novelty detection: firing rate for novel images minus firing rate for familiar images (dashed black; scale to left). (c) Strong population response to a familiar probe image immediately following a familiar leading image. The thin blue curve represents the mean across all 66 tested neurons of the firing rate elicited by the leading image followed by nothing and the thick red curve represents the mean firing rate elicited by the leading image followed by the probe image. The difference, indicated in yellow, is the response to the probe. The duration of each image was 120 ms. (d) Weak population response to a novel probe image immediately following a novel leading image. (e–f) The subset of 29 neurons selected for further testing showed the same pattern as the full population under conditions depicted in (c–d). (g) Neurons responded strongly to a novel probe immediately following a familiar leading image. (h) Neurons responded weakly to a familiar probe following a novel leading image.
Figure 6
Figure 6. In human subjects, rapidly alternating familiar images elicit stronger periodic scalp responses than rapidly alternating novel images
(a) Saturated red indicates scalp locations at which, in the group data, the difference in strength achieved significance at a level of p < 0.001 with Bonferroni correction for multiple comparisons. (b) Frequency domain analysis. Power at the driving frequency of 5.45 Hz was greater for familiar (red) than for novel (blue) image strings. (c) Time domain analysis. The peak to trough excursion was greater on average for familiar (red) than for novel (blue) strings. Traces in panels (b–c) represent measures obtained by averaging across the six electrodes circled in white in (a). (d) The scalp response elicited by an image which appeared at time zero and remained visible for 600 ms. The dorsal-to-ventral progress of the leading negative component (blue) presumably reflects the spread of activation from primary visual cortex to visual areas of higher order. The scalp region at which familiar image strings elicited significantly stronger driven periodic activity, visible as red in (a), was displaced laterally and ventrally from the zone of earliest negativity, visible as blue at 168 ms in (d).

References

    1. Ungerleider LG, Mishkin M. Two cortical visual systems. In: Ingle DJ, Goodale MA, Mansfield RJW, editors. Analysis of Visual Behavior. MIT Press Cambridge, MA; 1982. pp. 549–586.
    1. Sobotka S, Ringo J. Investigation of long-term recognition and association memory in unit responses from inferotemporal cortex. Experimental Brain Research. 1993;96:28–38. - PubMed
    1. Fahy FL, Riches IP, Brown MW. Neuronal activity related to visual recognition memory: long-term memory and the encoding of recency and familiarity information in the primate anterior and medial inferior temporal and rhinal cortex. Experimental Brain Research. 1993;96:457–472. - PubMed
    1. Xiang JZ, Brown MW. Differential neuronal encoding of novelty, familiarity and recency in regions of the anterior temporal lobe. Neuropharmacology. 1998;37:657–676. - PubMed
    1. Freedman DJ, Riesenhuber M, Poggio T, Miller EK. Experience-dependent sharpening of visual shape selectivity in inferior temporal cortex. Cerebral Cortex. 2006;16:1631–1644. - PubMed

Publication types

LinkOut - more resources