. 2014 Oct;15(10):973-81.
doi: 10.1038/ni.2965. Epub 2014 Aug 24.

B cell homeostasis and follicle confines are governed by fibroblastic reticular cells

Affiliations

B cell homeostasis and follicle confines are governed by fibroblastic reticular cells

Viviana Cremasco et al. Nat Immunol. 2014 Oct.

Abstract

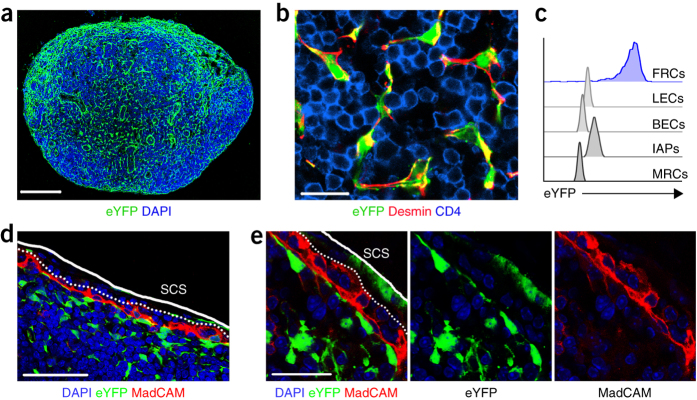
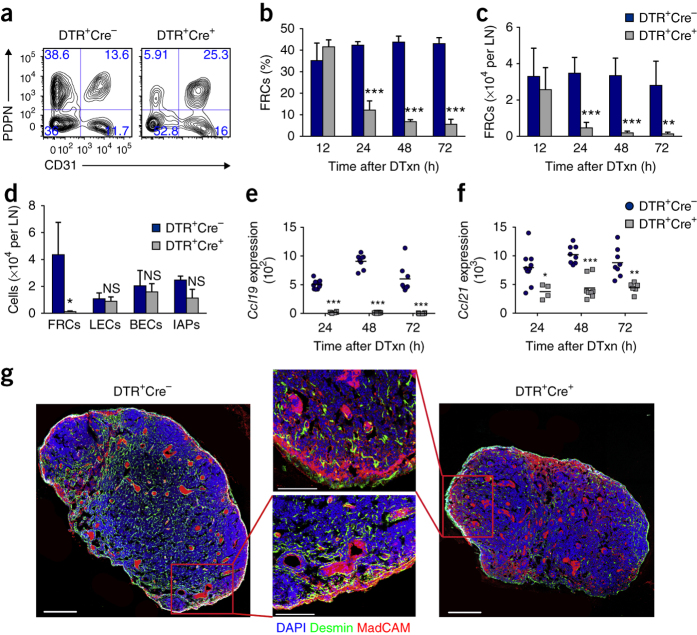
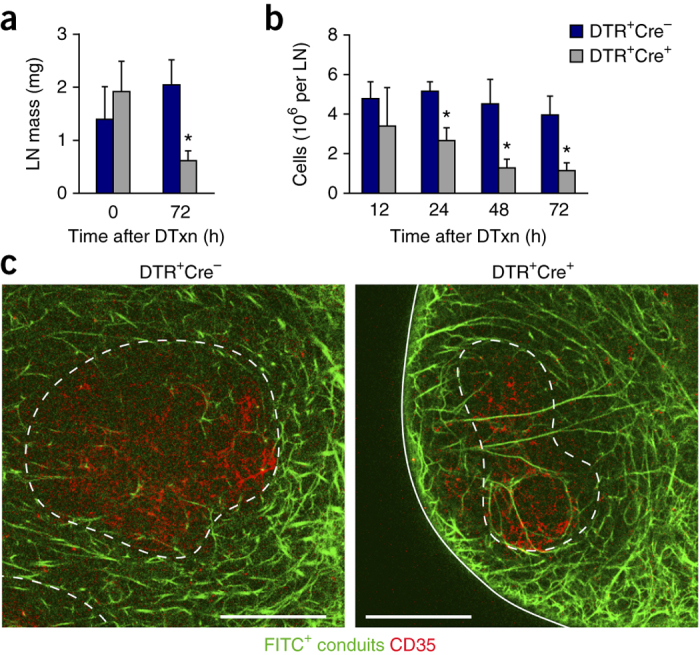
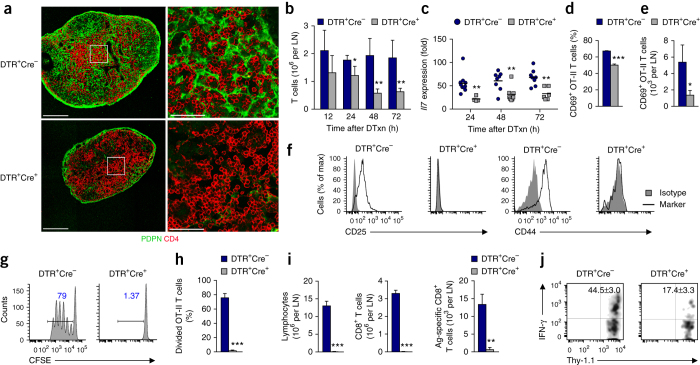
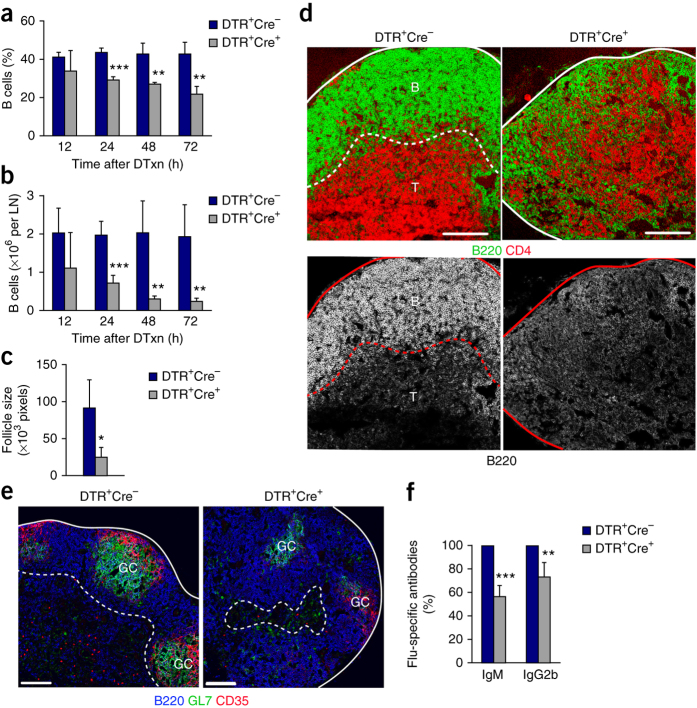
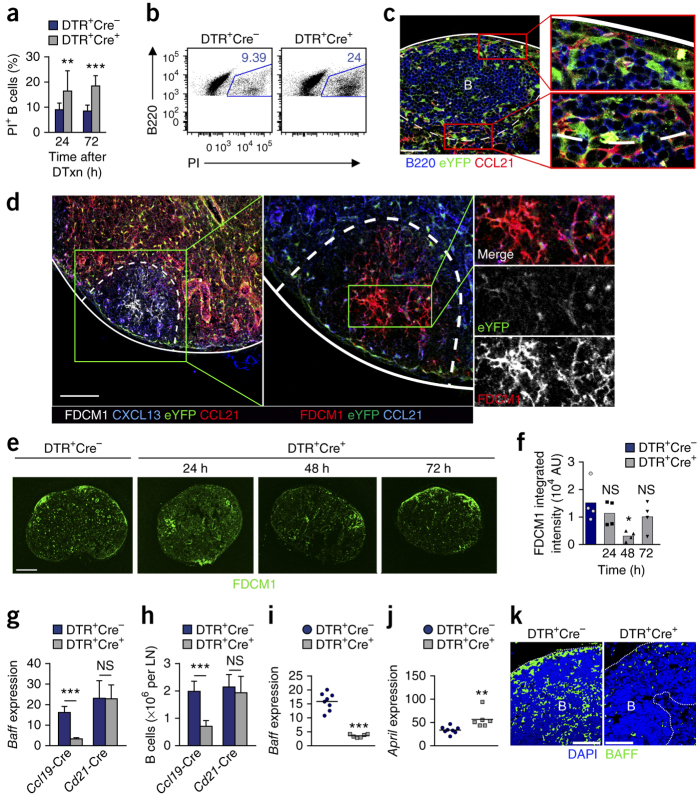
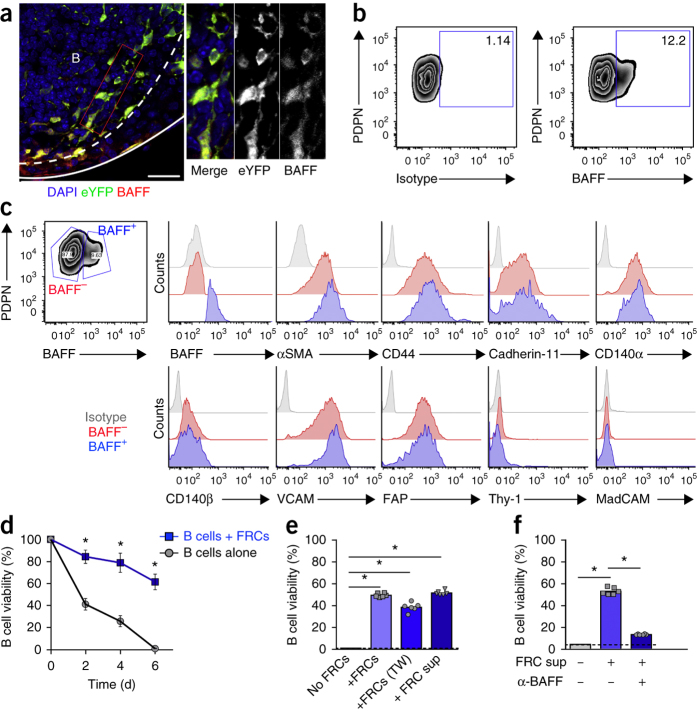
Fibroblastic reticular cells (FRCs) are known to inhabit T cell-rich areas of lymphoid organs, where they function to facilitate interactions between T cells and dendritic cells. However, in vivo manipulation of FRCs has been limited by a dearth of genetic tools that target this lineage. Here, using a mouse model to conditionally ablate FRCs, we demonstrated their indispensable role in antiviral T cell responses. Unexpectedly, loss of FRCs also attenuated humoral immunity due to impaired B cell viability and follicular organization. Follicle-resident FRCs established a favorable niche for B lymphocytes via production of the cytokine BAFF. Thus, our study indicates that adaptive immunity requires an intact FRC network and identifies a subset of FRCs that control B cell homeostasis and follicle identity.


Conflict of interest statement

The authors declare no competing financial interests.

Figures

Figure 1
Figure 1. Specific Ccl19 promoter activity in FRCs.
(a) Microscopy of a section of a popliteal lymph node from a Ccl19-Cre × Rosa26-eYFP reporter mouse, stained with an antibody to GFP (anti-GFP) that also stains eYFP and with the DNA-binding dye DAPI. Scale bar, 200 μm. (b) Enlargement of the paracortical area of a section as in a, stained for GFP, desmin and CD4. Scale bar, 25 μm. (c) Flow cytometry of freshly isolated stromal cells from Ccl19-Cre × Rosa26-eYFP mice, showing Ccl19 promoter activity via expression of eYFP. LECs, lymphatic endothelial cells; BECs, blood endothelial cells; IAPs, integrin α7-expressing pericytes. (d,e) Confocal microscopy of lymph nodes from Ccl19-Cre × Rosa26-eYFP mice, stained with DAPI, anti-GFP and anti-MadCAM, showing the ceiling (solid lines) and floor (dotted lines) of the subcapsular sinus (SCS). Scale bars, 50 μm (d) and 25 μm (e). Data are representative of three independent experiments with more than three mice (a,b,d,e) or two independent experiments with three mice (c).
Figure 2
Figure 2. Conditional ablation of FRCs.
(a) Identification of the FRC (PDPN+CD31) compartment (top left quadrant) in Ccl19-Cre × iDTR mice 24 h after the administration of DTxn. DTR+Cre+ mice express DTR in Ccl19-expressing cells, whereas DTR+Cre control mice lack DTR due to the absence of Cre expression. Numbers in quadrants indicate percent cells in each. (b,c) Frequency of FRCs among stromal (CD45) cells (b) and total FRCs per lymph node (LN) (c) in mice as in a at 12–72 h (horizontal axis) after administration of DTxn. (d) Flow cytometry of stromal cells in lymph nodes collected from Ccl19-Cre DTR+Cre+ and DTR+Cre mice 72 h after injection of DTxn: FRCs, CD45PDPN+CD31; lymphatic endothelial cells, CD45PDPN+CD31+; blood endothelial cells, CD45PDPNCD31+; integrin α7–expressing pericytes, CD45PDPNCD31. (e,f) Abundance of Ccl19 transcripts (e) and Ccl21 transcripts (f) in lymph nodes from mice as in a at 24, 28 or 72 h (horizontal axes) after administration of DTxn; results are normalized to those of the gene encoding cyclophillin. Each symbol represents one lymph node from an individual mouse (n = 4–10 per group); small horizontal lines indicate the mean. (g) Microscopy of MRCs in lymph nodes obtained from Ccl19-Cre DTR+Cre+ and DTR+Cre mice at 24 h after treatment with DTxn, identified by staining with anti-MadCAM, together with DAPI and anti-desmin; middle (insets), enlargement of areas outlined in main images. Scale bars, 200 μm (main images) or 100 μm (insets). NS, not significant; *P < 0.05, **P < 0.01 and ***P < 0.001 (Student's t-test). Data are representative of at least three independent experiments with four (ac) or three (d) mice per group in each (mean and s.d.), two to three experiments (f) or three independent experiments with over three mice (g). Source data
Figure 3
Figure 3. Ablation of FRCs has profound consequences on lymph node cellularity despite preserving conduit functionality.
(a,b) Lymph node mass (a) and total cellularity of lymph nodes (b) in Ccl19-Cre DTR+Cre+ and DTR+Cre mice (as in Fig. 2a) at various times (horizontal axes) after administration of DTxn. (c) Multiphoton microscopy of popliteal nodes from Ccl19-Cre DTR+Cre+ and DTR+Cre mice showing transport of a fluorescein isothiocyanate (FITC)-tagged tracer into conduits, plus staining with anti-CD35; dashed lines outline B cell follicles. Scale bars, 100 μm. *P < 0.001 (Student's t-test). Data are representative of at least two independent experiments with three mice per group in each (a,b; mean and s.d.) or two independent experiments with more than three mice (c). Source data
Figure 4
Figure 4. Ablation of FRCs impairs T cell immunity.
(a) Confocal microscopy of lymph node sections obtained from Ccl19-Cre DTR+Cre+ and DTR+Cre mice 3 d after treatment with DTxn and stained with anti-CD4 (T cells) and anti-PDPN (FRCs) to detect FRCs in paracortical areas; right, enlargement of areas outlined at left. Scale bars, 200 μm (left) or 50 μm (right). (b) Quantification of T cells (CD45+B220CD3+) in skin-draining lymph nodes from Ccl19-Cre DTR+Cre+ and DTR+Cre mice at 3 d after treatment with DTxn, assessed by flow cytometry. (c) Abundance of Il7 transcripts in lymph nodes from Ccl19-Cre DTR+Cre+ and DTR+Cre mice (n = 4–10 per group) at 3 d after treatment with DTxn (presented as in Fig. 2e,f). (d,e) Frequency (d) and total number (e) of antigen-specific activated donor T cells (CFSE+CD3+CD4+Vα5+CD69+) in popliteal nodes from Ccl19-Cre DTR+Cre+ and DTR+Cre host mice (n = 3 per group) treated with DTxn, then given adoptive transfer of CFSE-labeled OT-II T cells and then immunized in the footpad with ovalbumin-expressing, ultraviolet irradiation–inactivated influenza virus, assessed by flow cytometry 24 h after immunization. (f) Expression of CD25 and CD44 in antigen-specific T cells, assessed by flow cytometry 60 h after immunization as in d,e. Isotype, isotype-matched control antibody. (g) Proliferation of OT-II T cells from mice as in f. Numbers above bracketed lines indicate percent cells with CFSE dilution (i.e., cells that have proliferated). (h) Summary of results in g (n = 3 per group). (i) Quantification of lymphocytes, CD8+ T cells and antigen (Ag)-specific T cells in Ccl19-Cre DTR+Cre+ and DTR+Cre host mice (n = 3 per group) treated with DTxn, then given CD8+ T cells specific for the coronavirus spike protein before immunization with nonreplicating coronavirus particles, assessed 72 h after virus injection. (j) Intracellular staining of IFN-γ in mice as in i (n = 3 per group), assessed by flow cytometry. Numbers in top right quadrants indicate percent IFN-γ+ Thy-1.1+ (donor) cells (mean ± s.d.). *P < 0.05, **P < 0.01 and ***P < 0.001 (Student's t-test). Data are representative of three independent experiments with more than three mice (a), at least three independent experiments with four mice per group in each (b; mean and s.d.), at least three independent experiments experiments (c), two experiments with two to five mice per group (d–h; mean and s.d.) or one experiment with three mice (i,j; mean and s.d.). Source data
Figure 5
Figure 5. Ablation of FRCs is detrimental to B cells.
(a,b) Frequency of B cells (CD45+B220+CD3) among hematopoietic (CD45+) cells (a) and total B cells (b) in skin-draining lymph nodes from Ccl19-Cre DTR+Cre+ and DTR+Cre mice, assessed by flow cytometry. (c,d) Follicle size (c) and architecture (d) in lymph node sections from Ccl19-Cre DTR+Cre+ and DTR+Cre mice (n = 3 (c) or n > 3 (d)) at 3 d after injection of DTxn, assessed by staining with anti-B220 (B cells (B)) and anti-CD4 (T cells (T)). Solid lines (d), lymph node capsule; dashed lines (d), cortical-paracortical boundary. Scale bars (d), 100 μm. (e) Microscopy of germinal centers (GC) in popliteal nodes from Ccl19-Cre DTR+Cre+ and DTR+Cre mice 14 d after immunization with influenza virus, stained with anti-B220 (B cells), anti-GL7 (activated B cells) and anti-CD35 (FDCs). Scale bars, 100 μm. (f) Enzyme-linked immunosorbent assay of IgM and IgG2b influenza virus–specific antibodies in serum from mice as in e, assessing T cell–independent and T cell–dependent humoral responses, respectively. *P < 0.05, **P < 0.01 and ***P < 0.001 (Student's t-test). Data are representative of at least three independent experiments with four mice per group in each (a,b; mean and s.d.), three independent experiments (c,d; mean and s.d. in c), three experiments (e) or two independent experiments with three to five mice per group in each (f; mean and s.d.). Source data
Figure 6
Figure 6. Ablation of FRCs impairs B cell survival.
(a,b) Frequency of viable B cells in single-cell suspensions of lymph nodes from Ccl19-Cre DTR+Cre+ and DTR+Cre mice at 24 or 72 h (horizontal axis, a) or 72 h (b) after treatment with DTxn, assessed by staining with propidium iodide (PI) followed by flow cytometry. Numbers adjacent to outlined areas (b) indicate percent dying (PI+) B cells (CD45+B220+). (c) Confocal microcopy of lymph nodes from Ccl19-Cre × Rosa26-eYFP mice (n > 3), showing FRCs in follicular regions (lines as in Fig. 5d); right, enlargement (2.9×) of areas outlined at left. B, B cell follicle. Scale bar, 50 μm. (d) Confocal microcopy of a popliteal lymph node from a Ccl19-Cre × Rosa26-eYFP mouse, stained with anti-FDCM1, anti-CXCL13, anti-GFP and anti-CCL21 to detect chemokine expression (left) and FDCs (middle); right, single channels of the follicle area outlined at left (lines as in Fig. 5d). Scale bar, 100 μm (left), enlargement, 1.9× (middle) and 4.75× (right). (e) Confocal microscopy of popliteal lymph nodes from a Ccl19-Cre DTR+Cre mouse left untreated and from Ccl19-Cre DTR+Cre+ mice at 24, 48, or 72 h (above images) after administration of DTxn, stained with anti-FDCM1 to detect FDCs. Scale bar, 200 μm. (f) Cumulative FDCM1 expression in follicles in images as in e. Each symbol represents one lymph node from an individual mouse. AU, arbitrary units. (g,h) Baff expression (g) and quantification of B cells (h) in Ccl19-Cre (DTR+Cre+ and DTR+Cre) mice, in which FRCs were targeted, and Cd21-Cre mice (DTR+Cre+ and DTR+Cre) mice, in which FDCs were targeted, at 24 h after treatment with DTxn (presented as in Fig. 2e,f). (i,j) Abundance of Baff transcripts (i) and April transcripts (j) in lymph nodes from Ccl19-Cre DTR+Cre+ and DTR+Cre mice (n = 6–8 per group) 3 d after administration of DTxn (presented as in Fig. 2e,f). (k) Confocal microscopy of lymph nodes from Ccl19-Cre DTR+Cre+ and DTR+Cre mice in which FRCs were ablated, stained with anti-BAFF and DAPI. Scale bars, 50 μm. *P < 0.05, **P < 0.01 and ***P < 0.001 (Student's t-test). Data are representative of two independent experiments with three to five mice per group in each (a,b; mean and s.d. in a), three independent experiments with more than three mice (c), two independent experiments (d), three independent experiments with more than three mice per group (e), one experiment with more than three mice per group (f), one experiment with two to four mice per group (g,h; mean and s.d.), three independent experiments (i,j) or two independent experiments with two mice (k). Source data
Figure 7
Figure 7. FRCs support the survival of B cells through the production of BAFF.
(a) Microscopy of BAFF (stained with anti-BAFF) in FRCs (eYFP+ cells stained with anti-GFP) in a lymph node from a Ccl19-Cre × Rosa26-eYFP mouse; right, single channels of image at left (enlargement, 2×). Solid line, lymph node capsule; dashed line, B cell follicle. Scale bar, 20 μm. (b) Production of BAFF (right) by FRCs (PICD45PDPN+CD31MadCAM cells) among freshly isolated lymph node stromal cells from naive C57BL/6 mice, assessed by flow cytometry. Numbers in outlined areas indicate percent PDPN+ cells (left) or BAFF+ FRCs (right). (c) Expression of canonical FRC markers (horizontal axes) in BAFF+ or BAFF FRCs (sorting, top left), assessed by flow cytometry. αSMA, α-smooth muscle actin; FAP, fibroblast-activation protein. (d) Viability of purified B cells cultured alone or in the presence of FRCs (+FRCs), assessed daily by quantification of PIB220+ cells per well. (e) Viability of B cells cultured alone (No FRCs), in contact with FRCs (+FRCs), separated from FRCs by a Transwell filter (+FRCs (TW)) or with FRC-conditioned culture supernatant (+FRC sup), assessed at day 5 of culture. (f) Viability of B cells cultured with (FRC sup +) or without (FRC sup −) FRC-conditioned supernatant, with (α-BAFF +) or without (α-BAFF −) the addition of BAFF-neutralizing antibody, assessed by flow cytometry. Each symbol (e,f) represents an individual well. *P < 0.001 (Student's t-test). Data are representative of two independent experiments with three mice (a), three independent experiments with more than six mice (b), two experiments (c) or three independent experiments (df; mean and s.e.m. (d) or mean and s.d. (e,f) of at least three wells per group in each experiment). Source data

Similar articles

Cited by

References

    1. Mueller SN, Germain RN. Stromal cell contributions to the homeostasis and functionality of the immune system. Nat. Rev. Immunol. 2009;9:618–629. - PMC - PubMed
    1. Turley SJ, Fletcher AL, Elpek KG. The stromal and haematopoietic antigen-presenting cells that reside in secondary lymphoid organs. Nat. Rev. Immunol. 2010;10:813–825. - PubMed
    1. Gretz JE, Norbury CC, Anderson AO, Proudfoot AE, Shaw S. Lymph-borne chemokines and other low molecular weight molecules reach high endothelial venules via specialized conduits while a functional barrier limits access to the lymphocyte microenvironments in lymph node cortex. J. Exp. Med. 2000;192:1425–1440. - PMC - PubMed
    1. Roozendaal R, et al. Conduits mediate transport of low-molecular-weight antigen to lymph node follicles. Immunity. 2009;30:264–276. - PMC - PubMed
    1. Sixt M, et al. The conduit system transports soluble antigens from the afferent lymph to resident dendritic cells in the T cell area of the lymph node. Immunity. 2005;22:19–29. - PubMed

Publication types

MeSH terms