. 2014 Oct;15(10):929-937.
doi: 10.1038/ni.2967. Epub 2014 Aug 24.

Constant replenishment from circulating monocytes maintains the macrophage pool in the intestine of adult mice

Affiliations

Constant replenishment from circulating monocytes maintains the macrophage pool in the intestine of adult mice

Calum C Bain et al. Nat Immunol. 2014 Oct.

Erratum in

  • Nat Immunol. 2014 Nov;15(11):1090

Abstract

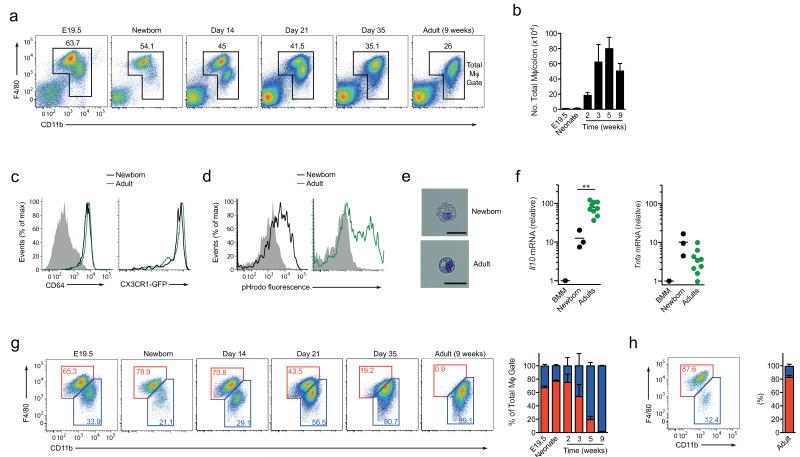
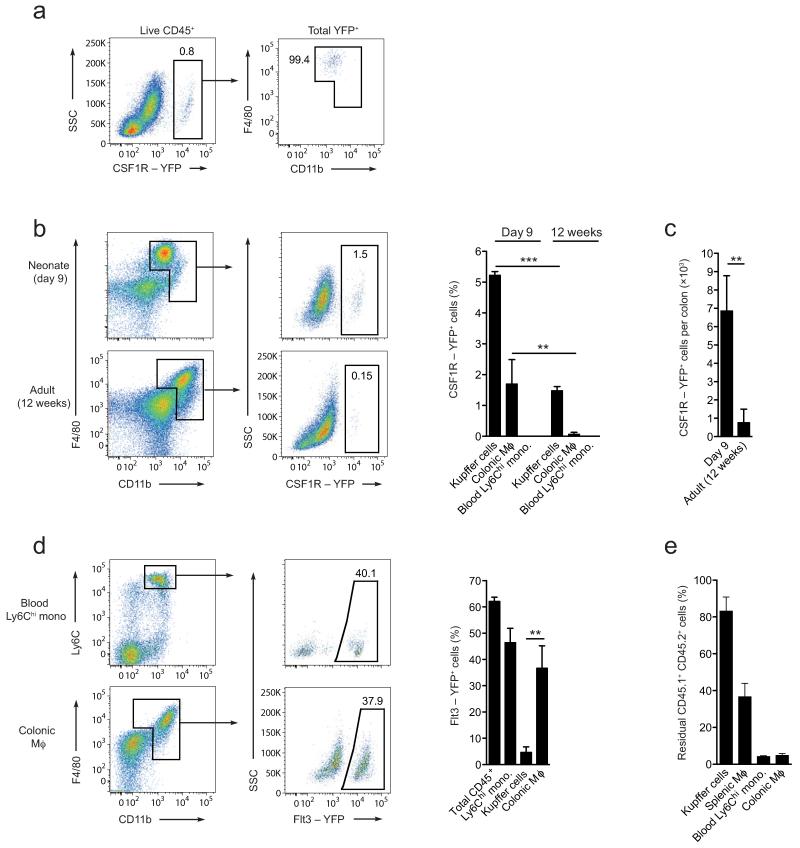
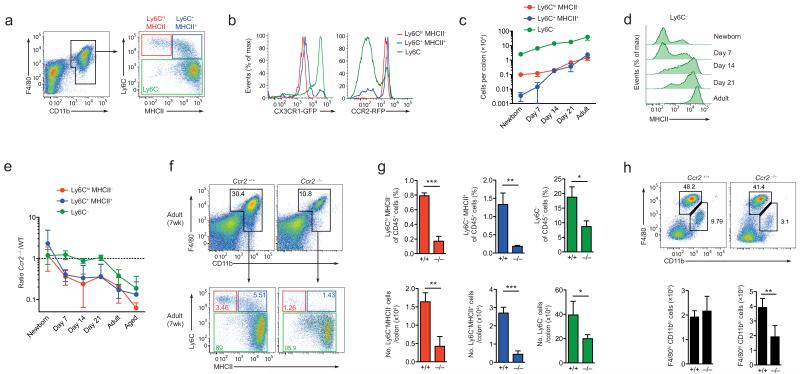
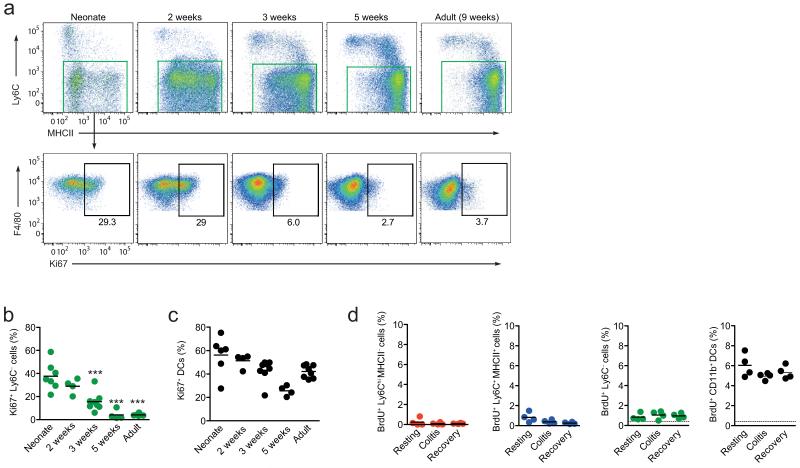
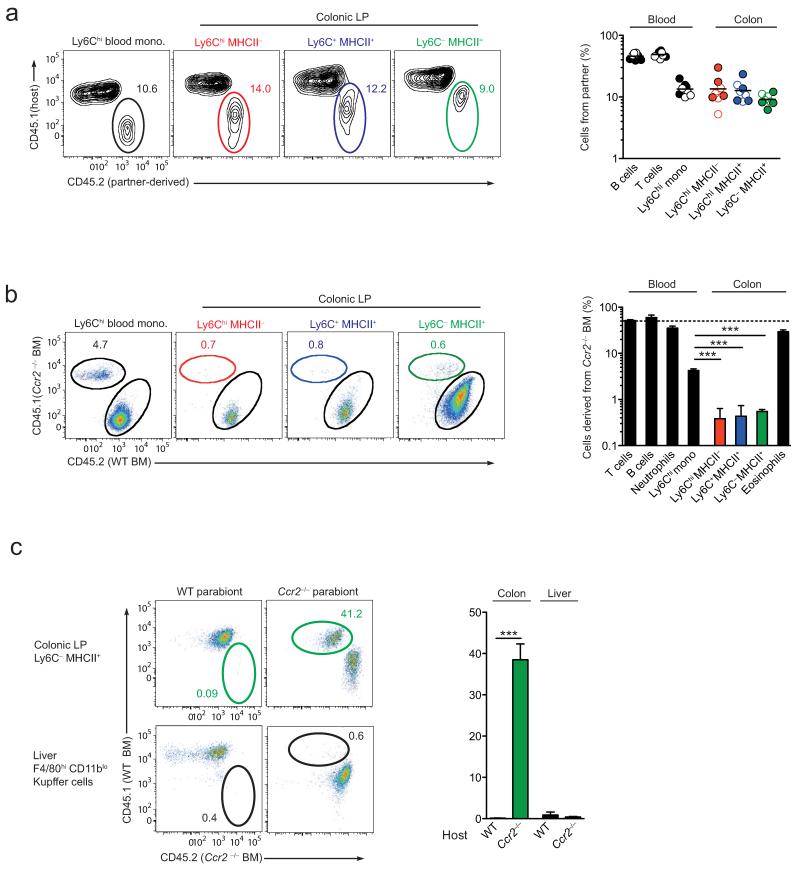
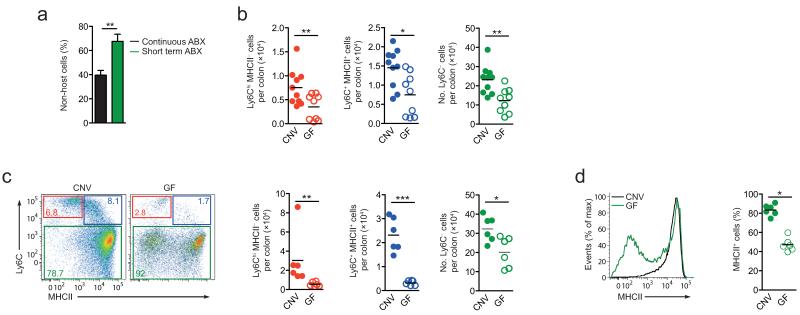
The paradigm that macrophages that reside in steady-state tissues are derived from embryonic precursors has never been investigated in the intestine, which contains the largest pool of macrophages. Using fate-mapping models and monocytopenic mice, together with bone marrow chimera and parabiotic models, we found that embryonic precursor cells seeded the intestinal mucosa and demonstrated extensive in situ proliferation during the neonatal period. However, these cells did not persist in the intestine of adult mice. Instead, they were replaced around the time of weaning by the chemokine receptor CCR2-dependent influx of Ly6C(hi) monocytes that differentiated locally into mature, anti-inflammatory macrophages. This process was driven largely by the microbiota and had to be continued throughout adult life to maintain a normal intestinal macrophage pool.


Figures

Figure 1
Figure 1. F4/80 and CD11b expression identifies macrophage subsets in neonatal and adult colon
(a) F4/80 and CD11b expression by live CD45+SiglecFLy6GCD11clo colonic LP cells from neonatal (day 2), day 14, day 21, day 35 and 9 week old CX3CR1+/gfp mice. (b) Absolute numbers of total F4/80+ CD11b+ cells per colon in day 2, day 14, day 21, day 35 and 9 week old CX3CR1+/gfp mice. (c) CD64 and CX3CR1-GFP expression by F4/80+ CD11b+ colonic LP cells from newborn (day 2; black line) and 8 week old (green line) CX3CR1+/gfp mice. Shaded histogram represents isotype control. (d) Phagocytic activity of F4/80+ CD11b+ colonic LP cells from newborn (day 2) or adult CX3CR1+/gfp mice measured by the uptake of pHrodo Escherichia coli bioparticles for 30-60 mins at 37°C or 4°C as a control (shaded histograms). (e) Morphological appearance of F4/80+ CD11b+ colonic mφ from newborn and adult mice. Scale bar 25μm. (f) qRT-PCR of mRNA for IL10 and TNFα by F4/80hi LP mφ from newborn (day 1) or adult mice, and BM-derived mφ (BMM). Results are mean expression relative to cyclophilin A (CPA) + 1SD obtained using the 2−dΔC(t), with BMM set to 1. **P<0.01 (Student’s t-test). (g, h) Representative plots and mean frequencies of F4/80hi CD11blo (red) and F4/80lo CD11b+ (blue) subsets of total colonic LP mφ from newborn (day 2), day 14, day 21, day 35 and 9 week old CX3CR1+/gfp mice (g) or from 8 week old wild-type liver (h). Data are from one of 3 (a, b, g, h), or 2 independent experiments with two mice (c), of two independent experiments with 3 mice per group (d), or are representative images from two independent experiments (e). Results in b, g, h are means ± 1 SD of 6 (neonate timepoint) or 4 (day 14, 21 and 35, and 9 week old timepoints) mice per group. Data from E19.5 embryos are from two experiments each using cells pooled from 8 mice. For qRT-PCR analysis (f), data represent 3 (neonate) or 9 (adult) biological replicates using RNA pooled from 1-2 adults or 5 neonates.
Figure 2
Figure 2. The colonic macrophage compartment is dependent on conventional hematopoiesis
(a) YFP expression by total live CD45+ colonic leukocytes (left panel) from 9 day old progeny of Csf1r-mer-iCre-mer Rosa26-LSL-YFP mice injected with tamoxifen at E8.5 to pulse label CSF1R+ YS macrophages (left panel); expression of F4/80 and CD11b by total YFP+ cells (right panel). (b) Representative YFP expression by F4/80+ CD11b+ colonic LP cells from 9 day or 12 week old progeny of Csf1r-mer-iCre-mer Rosa26-LSL-YFP mice treated as in a. Bar chart shows the mean frequency of YFP+ cells amongst F4/80hi CD11blo liver Kupffer cells, total F4/80+ CD11b+ colonic LP cells and amongst Ly6Chi blood monocytes from 9 day or 12 week old progeny of Csf1r-mer-iCre-mer Rosa26-LSL-YFP mice treated as above. **P<0.01, ***P<0.0001 (Student’s t-test). (c) Absolute number of eYFP-expressing F4/80+ CD11b+ colonic LP cells from 9 day or 12 week old adult progeny of Csf1r-mer-iCre-mer Rosa26-LSL-YFP mice. (d) Representative eYFP expression (upper panels) and mean eYFP expression (lower panel) by total CD45+ blood leukocytes, Ly6Chi blood monocytes, F4/80hi CD11blo liver KC and colonic F4/80+ CD11b+ cells from 8 week old progeny of Flt3-Cre Rosa26-LSL-YFP mice. **P<0.005 (Student’s t-test). (e) Proportions of CD45.1+CD45.2+ residual host cells amongst Ly6Chi blood monocytes, total F4/80+ CD11b+ colonic LP cells, F4/80hi CD11blo liver Kupffer cells and F4/80hi CD11blo splenic macrophages of WT:Ccr2−/− mixed BM chimeric mice 8 weeks after reconstitution. a, b, c: Data are means + 1 SD and are pooled from two independent experiments with 3 or 4 mice per group (12 week old), or from one experiment with 3 mice (9 day old). d, e: Data are means + 1 SD and are from one of two independent experiments with 3 mice.
Figure 3
Figure 3. Maturation and CCR2-dependence of intestinal macrophage development
(a) Ly6C and MHCII expression by colonic F4/80+CD11b+ cells from adult CX3CR1+/gfp mice. (b) CX3CR1 and CCR2 expression by Ly6ChiMHCII, Ly6ChiMHCII+ and Ly6C subsets from CX3CR1+/gfp and CCR2+/rfp mice respectively. (c) Absolute numbers of colonic Ly6ChiMHCII, Ly6C+MHCII+ and Ly6C subsets from newborn (day 0-1), day 7, day 14, day 21 and 7-8 week old CX3CR1+/gfp mice. (d) MHCII expression by F4/80+CD11b+Ly6C colonic LP cells from newborn (day 0-1), day 7, day 14, day 21 and 7-8 week old CX3CR1+/gfp mice. (e) Numbers of Ly6ChiMHCII, Ly6C+MHCII+ and Ly6C subsets in colon of newborn (day 0-1), day 7, day 14, day 21, 7 week old and in 9-12 month old adult Ccr2−/− mice, shown as ratios to the equivalent populations in age-matched Ccr2+/+ mice. (f) Representative F4/80 and CD11b expression by live CD45+SiglecFLy6GCD11clo colonic LP cells and Ly6C and MHCII expression by total F4/80+CD11b+ cells from 7 week old Ccr2+/+ or Ccr2−/− mice. (g) Mean proportions and absolute numbers of Ly6ChiMHCII, Ly6C+MHCII+ and Ly6C subsets in colon of 7 week old Ccr2+/+ or Ccr2−/− mice. *P<0.05, **P<0.01, ***P<0.001 (Student’s t-test). (h) Representative F4/80 and CD11b expression by live CD45+SiglecFLy6GCD11clo liver cells from 8 week old Ccr2+/+ or Ccr2−/− mice. Bar charts show the absolute numbers of F4/80hiCD11blo and F4/80loCD11b+ cells from livers of 8wk old Ccr2+/+ or Ccr2−/− mice. **P<0.01 (Student’s t-test). Data are representative of 3 independent experiments (a, f, g, h and Cx3cr1+/gfp mice in b), or from one experiment (Ccr2+/rfp mice in b), or are pooled from two independent time course experiments (c, d, e). Aged mice were examined in one experiment. Results in c, e, g, h are means ± 1 SD of 6-8 (c, e) or 3-4 mice (g, h) per group.
Figure 4
Figure 4. Proliferative activity of intestinal macrophages in situ
(a) Expression of Ki67 by F4/80+ CD11b+ Ly6C colonic mφ from early neonate (day 3), day 14, day 21, day 35 and 9-12 week old adult CX3CR1+/gfp mice. (b, c) Proportions of Ki67+ F4/80+ CD11b+ Ly6C(b) and Ki67+ CD11chi F4/80 DC (c) in colon of mice of different ages. The results are of 4-7 individual mice pooled from 2 independent experiments. Each dot represents an individual mouse. ***P<0.0001 (One way ANOVA followed by Bonferroni’s multiple comparison test). (d) Proportion of BrdU+ cells amongst CD64+ Ly6ChiMHCII, Ly6C+MHCII+, Ly6C cells and CD64 CD11b+ DC from the colons of resting mice, mice administered 2% DSS for 3 days (colitis) and mice given DSS for 3 days followed by 3 days of normal water (recovery). Mice were administered BrdU 3 hours prior to sacrifice and the dotted line represents the limit of detection as shown by BrdU staining in a non-DNase treated control sample. Data are pooled from two independent experiments with 4-7 seven mice at each time point (a, b, c), or are from one of two independent experiments with 4 mice per group (d). Each circle represents an individual mouse.
Figure 5
Figure 5. Colonic macrophages derive from classical Ly6Chi monocytes
(a) Representative chimerism of Ly6Chi blood monocytes and Ly6ChiMHCII, Ly6C+MHCII+ and Ly6C subsets of colonic F4/80+ CD11b+ cells from the CD45.1+ partner of wild-type:wild-type parabionts 10 weeks after joining. Scatter plot shows the proportions of non-host derived cells amongst B and T lymphocytes and Ly6Chi monocytes in blood, and colonic Ly6ChiMHCII, Ly6C+MHCII+ and Ly6C subsets from individual CD45.1+ (open circles) and CD45.2+ (filled circles) parabionts. (b) Representative dot plots of the chimerism of Ly6Chi blood monocytes and of the colonic Ly6ChiMHCII, Ly6C+MHCII+ and Ly6C subsets from wild-type (CD45.2+):Ccr2−/− (CD45.1+) mixed BM chimeric mice. Bar chart shows the mean proportions of cells derived from Ccr2−/− CD45.1+ BM amongst CD3+ T cells, CD19+ B cells, Ly6Chi monocytes and Ly6G+ neutrophils in blood, and amongst the colonic Ly6ChiMHCII, Ly6C+MHCII+ and Ly6C subsets, together with F4/80+ CD11b+ MHCII SSChi eosinophils in the colon of WT (CD45.1+):Ccr2−/− (CD45.2+) mixed BM chimeric mice. ***P<0.0001 (Student’s t-test). (c) Representative non-host chimerism amongst Ly6C colonic mφ and F4/80hi CD11blo liver Kupffer cells from the WT partner (left plots) and the Ccr2−/− partner (right plots) of WT-Ccr2−/− parabiotic mice 10 weeks after establishment of parabiosis. Bar chart shows the mean proportion of non-host chimerism amongst Ly6C colonic mφ and F4/80hi CD11blo liver Kupffer cells in the WT and Ccr2−/− partner of WT-Ccr2−/− parabiotic mice. ***P<0.0001 (Student’s t-test). Data are from one experiment (a), or from one of two independent experiments (b), or are pooled from three experiments (c). Results are the means ± 1 SD of 3 (b) or 4-6 mice per group (c).
Figure 6
Figure 6. Influence of the commensal microbiota on the development of colonic macrophages
(a) Non-host chimerism of CD64+/F4/80+ Ly6C colonic mφ in Ccr2−/− partners of WT-Ccr2−/− parabiotic mice given broad spectrum antibiotics for the first 4 weeks after surgery (Abx. 4wks), compared with the group of mice shown in Fig. 5c that received antibiotics for the entire 8 weeks of the study (continuous Abx). **P<0.01 (Student’s t-test). (b) Absolute numbers of the Ly6ChiMHCII, Ly6C+MHCII+ and Ly6C subsets of F4/80+ CD11b+ cells per colon of adult conventionally housed (CNV) and germ free (GF) mice. *P<0.05, **P<0.005 (Mann Whitney). (c) Representative dot plots of Ly6C and MHCII expression by F4/80+ CD11b+ colonic LP cells from 3 week old Rag1−/− CNV and GF mice. Scatter plots show the absolute numbers of the Ly6ChiMHCII, Ly6C+MHCII+ and Ly6C subsets of F4/80+ CD11b+ cells per colon of individual 3 week old CNV and GF mice. *P<0.05, ***P<0.0001 (Mann Whitney). (d) Representative expression of MHCII by F4/80+ CD11b+ Ly6C colonic LP cells from 3 week old mice and mean proportion of F4/80+ CD11b+ Ly6C MHCII+ cells amongst total F4/80+ CD11b+ colonic LP cells. *P<0.05 (Student’s t-test). Data are means + 1 SD of results pooled from two independent experiments using 3 (a) or 10 mice per group (b), or are from one of two independent experiments with 6 mice per group (c, d).

References

    1. Davies LC, Jenkins SJ, Allen JE, Taylor PR. Tissue-resident macrophages. Nat. Immunol. 2013;14:986–995. - PMC - PubMed
    1. van Furth R, et al. The mononuclear phagocyte system: a new classification of macrophages, monocytes, and their precursor cells. Bull World Health Organ. 1972;46:845–852. - PMC - PubMed
    1. Schulz C, et al. A lineage of myeloid cells independent of Myb and hematopoietic stem cells. Science (New York, N.Y. 2012;336:86–90. - PubMed
    1. Hashimoto D, et al. Tissue-resident macrophages self-maintain locally throughout adult life with minimal contribution from circulating monocytes. Immunity. 2013;38:792–804. - PMC - PubMed
    1. Hoeffel G, et al. Adult Langerhans cells derive predominantly from embryonic fetal liver monocytes with a minor contribution of yolk sac-derived macrophages. J. Exp. Med. 2012;209:1167–1181. - PMC - PubMed

Publication types

MeSH terms