Review
. 2014 Aug 8:8:96.
doi: 10.3389/fncir.2014.00096. eCollection 2014.

A simpler primate brain: the visual system of the marmoset monkey

Affiliations
Review

A simpler primate brain: the visual system of the marmoset monkey

Samuel G Solomon et al. Front Neural Circuits. .

Abstract

Humans are diurnal primates with high visual acuity at the center of gaze. Although primates share many similarities in the organization of their visual centers with other mammals, and even other species of vertebrates, their visual pathways also show unique features, particularly with respect to the organization of the cerebral cortex. Therefore, in order to understand some aspects of human visual function, we need to study non-human primate brains. Which species is the most appropriate model? Macaque monkeys, the most widely used non-human primates, are not an optimal choice in many practical respects. For example, much of the macaque cerebral cortex is buried within sulci, and is therefore inaccessible to many imaging techniques, and the postnatal development and lifespan of macaques are prohibitively long for many studies of brain maturation, plasticity, and aging. In these and several other respects the marmoset, a small New World monkey, represents a more appropriate choice. Here we review the visual pathways of the marmoset, highlighting recent work that brings these advantages into focus, and identify where additional work needs to be done to link marmoset brain organization to that of macaques and humans. We will argue that the marmoset monkey provides a good subject for studies of a complex visual system, which will likely allow an important bridge linking experiments in animal models to humans.

Keywords: Callitrichidae; extrastriate cortex; retina; striate cortex; thalamus; vision.


Figures

Figure 1
Figure 1
Lateral (left) and medial (right) views of the marmoset cerebral cortex, showing the location of visual areas. The images are representations of the reference brain reconstructed in detail by Paxinos et al. (2012). Names within parentheses indicate the names of likely homologous areas in macaque brain. Colors denote different subdivisions of visual cortical pathways, as follows. Magenta: primary visual cortical area (V1). Pink: visuotopically organized areas of extrastriate cortex. Green: posterior parietal cortex. Dark blue: inferior temporal cortex. Light blue: polysensory areas of the superior temporal cortex. Orange: “limbic” visual areas. Yellow: frontal cortex visual association areas, including frontal eye fields. Abbreviations: 8aV, cytoarchitectural area 8a ventral; 23V, cytoarchitectural area 23 ventral; AIP, anterior intraparietal area; DA, dorsoanterior area (probable homolog of macaque area V3a); DI, dorsointermediate area; DM, dorsomedial area (probable homolog of macaque area V6); FST, fundus of superior temporal area; FSTv, fundus of superior temporal ventral area (probable homolog of macaque cytoarchitectural areas PGa and IPa); ITc, caudal inferior temporal area (probable homolog of macaque area TEO); ITd, dorsal inferior temporal area; ITv, ventral inferior temporal area; LIP, lateral intraparietal area; MIP, medial intraparietal area; MST, medial superior temporal area; MT, middle temporal area (probable homolog of macaque area V5); MTC, middle temporal crescent (probable homolog of macaque area V4T); OPt, cytoarchitectural area OPt; PEC, cytoarchitectural area PE caudal; PG, cytoarchitectural area PG; PGM, cytoarchitectural area PG medial; PPM, posterior parietal medial area (probable homolog of macaque area V6a); ProSt, area prostriata; STP, superior temporal polysensory area (probable homolog of macaque cytoarchitectural area TPO); TF/ TL, cytoarchitectural areas TF and TL; V1, primary visual area; V2, second visual area; VIP, ventral intraparietal area; VLA, ventrolateral anterior area (probable homolog of macaque area V4); VLP, ventrolateral posterior area (probable homolog of macaque area V3).
Figure 2
Figure 2
The two major retino-thalamic pathways in marmoset. (A) Camera lucida drawings of representative midget (parvocellular-pathway) and parasol (magnocellular-pathway) ganglion cells in marmoset retina, each located about 1 mm from the fovea (reproduced from Ghosh et al., 1996). (B) Photomicrograph of the LGN, showing the pairs of parvocellular (P) and magnocellular (M) layers; the dorsal most P layer and ventral most M layer get input from the contralateral eye; the internal layers get input from the ipsilateral eye. These layers are embedded in a matrix of koniocellular cells that lie between the principal layers, including two prominently segregated zones (K1, K3). Scale bar = 0.5 mm. (C) peristimulus time histograms of the responses of representative OFF P- and M-cells to brief (0.2 s) decrements in light from a gray background. The P-cell shows sustained response, the M-cell shows transient response (reproduced from Cheong and Pietersen, 2014). Y-axis scale bars 50 impulses/s. Thick black bar shows the time and duration of the stimulus. (D) Spatial-frequency tuning of representative P- and M-cells for drifting achromatic gratings, modulated at 4 Hz (adapted from White et al., 2001). Y-axis scale bars 20 impulses/s. (E) Contrast response of representative P- and M-cells for drifting gratings of optimal spatial frequency (adapted from Cheong and Pietersen, 2014).
Figure 3
Figure 3
Location and visuotopic organization of marmoset primary visual cortex (V1). Top: caudal and medial views of the marmoset cerebral cortex, showing the location of V1 (red). The dashed line indicates the region reconstructed in the bottom panels. Middle: The representation of eccentricity from the fovea (“Ecc,” in degrees of visual angle), according to the color scale shown on the right. This reconstruction represents data from a single individual, in which hundreds of recording sites were obtained (Chaplin et al., 2013a). The portion of V1 exposed on the caudal surface of the brain corresponds to the representation of the fovea and parafovea (dark blue), while the far periphery of the visual field is represent at the most anterior portion of the calcarine sulcus (red). Bottom: The representation of polar angle (“Ang”) in the same individual. The lower contralateral visual field (blue, cyan) is found on the dorsal surface, and the upper contralateral field (yellow, orange, red) is found on the ventral surface. The representation of the horizontal meridian (green) divides V1 nearly equally.
Figure 4
Figure 4
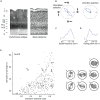
The primary visual cortex (V1) of marmoset. (A) Photomicrographs of neighboring coronal sections through V1, showing the laminar structure as revealed by staining for cytochrome oxidase (left) and Nissl substance (right). Scale bar = 0.5 mm. Reproduced from Solomon (2002). The terminology of layers follows that defined by Brodmann. (B) Tuning for grating orientation and direction in two representative V1 neurons. Left: orientation selective neuron, responding equally well to gratings of appropriate orientation, in both directions of drift (adapted from Cheong et al., 2013). Right: direction selective neuron (adapted from Tinsley et al., 2003). (C) Spatial frequency tuning of representative parafoveal V1 neuron (adapted from Yu and Rosa, 2014); the response to low spatial frequencies is negligible. (D) Tuning for the size of a patch of drifting grating, of optimal spatial frequency (adapted from Yu and Rosa, 2014): response is suppressed in large sizes, showing presence of extraclassical receptive field modulation, or suppressive surround. Scale bars in (B–D) show 20 impulses/s. (E) Distribution of orientation selectivity amongst V1 neurons in marmoset. The abscissa shows an orientation selectivity index based on the circular variance (higher numbers indicate poorer tuning); the ordinate shows half-width at halfheight of a von Mises function fit to the tuning curve. The inset at right shows orientation tuning of example neurons that are indicated in the plot. Adapted from Yu and Rosa (2014).
Figure 5
Figure 5
Schematic organization of visual cortex in the marmoset. “Unfolded” representation prepared using the technique of Van Essen and Maunsell (1980). Discontinuities in the representation, introduced to minimize distortion, are indicated by the arrows. Continuous black lines indicate the main cortical folds, including the lips and fundi of the lateral and calcarine sulci, the fundi of the superior temporal and intraparietal dimples, and the limits of the medial, ventral, and orbital surfaces. The inset on the lower left shows a lateral view of the intact marmoset brain, with boundaries of some visual areas indicated to help orientation. Colors indicate visual areas that have been mapped using electrophysiological techniques; other areas are simply indicated by labels in their approximate location. For abbreviations, see legend of Figure 1. The light gray dashed outlines indicate the borders of the primary auditory (A1), motor (M1), and somatosensory (S1) areas, for orientation. The topographic organization of visual areas is indicated according to the following symbols: white squares, representations of the vertical meridian (VM); black circles, representations of the horizontal meridian (HM); “+,” representations of upper contralateral quadrant; “-,” representations of the lower contralateral quadrant; red dashed lines, isoeccentricity lines (numbers indicate eccentricity from the fovea, in degrees).
Figure 6
Figure 6
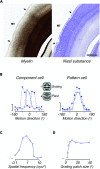
The middle temporal area (MT) of marmoset. (A) Photomicrograph of adjacent coronal sections, showing the histological distinctiveness of area MT revealed by myelin (left) and Nissl (right) stains. MT stands out as heavily myelinated in comparison with most cortical areas. Although the boundaries are less obvious, MT can also be identified in Nissl stained sections by the thinner and denser layer IV, and by the thicker layer VI, in comparison with adjacent areas. Scale bar = 1 mm. (B) Direction tuning for gratings and plaids in two representative directions elective MT neurons. The left panel illustrates the responses of a “component-cell,” which shows bi-lobed tuning for plaids, as if it responded to the individual gratings that comprise the plaid. The right panel shows the responses of a “pattern-cell,” which has similar direction tuning to gratings and plaids. (C) Spatial frequency tuning of a representative “component cell” in the peripheral representation of MT; the response to low spatial frequencies is neglible. (D) Tuning for the size of a patch of drifting grating, of optimal spatial frequency, showing large receptive field size of neurons in area MT. Scale bars in B show 20 impulses/s. (B–D) adapted from Solomon et al. (2011).

References

    1. Adams D. L., Horton J. C. (2003). Capricious expression of cortical columns in the primate brain. Nat. Neurosci. 6 113–114 10.1038/nn1004 - DOI - PubMed
    1. Allman J. M., Kaas J. H. (1976). Representation of the visual field on the medial wall of occipital-parietal cortex in the owl monkey. Science 191 572–575 10.1126/science.814619 - DOI - PubMed
    1. Andressen C., Mai J. K. (1997). Localization of the CD15 carbohydrate epitope in the vertebrate retina. Vis. Neurosci. 14 253–262 10.1017/S0952523800011391 - DOI - PubMed
    1. Azzopardi P., Cowey A. (1993). Preferential representation of the fovea in the primary visual cortex. Nature 361 719–721 10.1038/361719a0 - DOI - PubMed
    1. Barraclough N., Tinsley C., Webb B., Vincent C., Derrington A. (2006). Processing of first-order motion in marmoset visual cortex is influenced by second-order motion. Vis. Neurosci. 23 815–824 10.1017/S0952523806230141 - DOI - PubMed

Publication types

LinkOut - more resources