Review
. 2014 Jun 12:2:20.
doi: 10.3389/fbioe.2014.00020. eCollection 2014.

Super-resolution molecular and functional imaging of nanoscale architectures in life and materials science

Affiliations
Review

Super-resolution molecular and functional imaging of nanoscale architectures in life and materials science

Satoshi Habuchi. Front Bioeng Biotechnol. .

Abstract

Super-resolution (SR) fluorescence microscopy has been revolutionizing the way in which we investigate the structures, dynamics, and functions of a wide range of nanoscale systems. In this review, I describe the current state of various SR fluorescence microscopy techniques along with the latest developments of fluorophores and labeling for the SR microscopy. I discuss the applications of SR microscopy in the fields of life science and materials science with a special emphasis on quantitative molecular imaging and nanoscale functional imaging. These studies open new opportunities for unraveling the physical, chemical, and optical properties of a wide range of nanoscale architectures together with their nanostructures and will enable the development of new (bio-)nanotechnology.

Keywords: cellular imaging; fluorescence microscopy; nanomaterials; nanostructures; super-resolution.


Figures

Figure 1
Figure 1
Principles of super-resolution fluorescence structural imaging. Schematic illustrations of the principles of (A) STED microscopy, (B) (S)SIM, and (C) localization microscopy.
Figure 2
Figure 2
Scheme of the switching of fluorescence states for super-resolution fluorescence localization microscopy. (A) Photo-induced switching, (B) photo-induced redox switching, (C) selective adsorption, (D) photo- and thermal-induced switching, and (E) chemical or enzymatic reaction-induced switching.
Figure 3
Figure 3
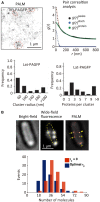
Quantitative super-resolution fluorescence imaging. (A) (Top left) PALM image of transferrin receptor (TfR) across the plasma membrane of COS7 cells. A photoactivatable fluorescent protein PAGFP is fused to TfR; (top right) plot of calculated autocorrelation function [g(r)peaks] of PAGFP molecules in the PALM image. g(r)stoch and g(r)protein are the correlation owing to multiple appearances of a single protein and the protein correlation. The cluster size and average numbers of the molecule in clusters are estimated by a fitting of the autocorrelation plot with an exponential decaying function; (bottom) size and number of molecules in clusters of a transmembrane protein, Lat (Sengupta et al., 2011). (B) (Top) bright-field microscopy, wide-field fluorescence microscopy, and PALM images of a flagellar motor protein, FliM, in bacterial cells. A photoconvertable fluorescent protein Dendra2 is fused to FliM; (bottom) frequency histogram of number of FliM molecules in each cluster determined using the Fermi activation with optimal tolerance time (blue bars). The red bars show the histogram without optimizing the tolerance time (Lee et al., 2012). Reproduced with permission from Sengupta et al. (2011), copyright 2011, Nature Publishing Group (A), and Lee et al. (2012), copyright 2012, National Academy of Science, USA (B).
Figure 4
Figure 4
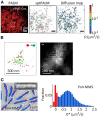
Super-resolution fluorescence molecular imaging. (A) PALM image, sptPALM image, and diffusion map of a membrane protein, VSVG, in COS7 cells. A photoconvertable fluorescent protein tdEosFP is fused to VSVG. The PALM image was obtained by the temporal activation of tdEosFP–VSVG followed by the localization and reconstruction of the image. The sptPALM image was obtained by tracking the activated tdEosFP–VSVG molecules. The diffusion map was obtained by calculating the diffusion coefficient of individual tdEosFP–VSVG molecules using the diffusion trajectories (Manley et al., 2008). (B) (Left) the first (red) and last (green) localized positions of single actin molecules within dendritic spines. The positions were determined by the sptPALM imaging. A photoactivatable fluorescent protein PAGFP is fused to actin; (right) actin dynamics within individual spines. Orientation and length of the arrows represent direction and velocity of actin flow. They were calculated using the first and last positions of the diffusion trajectories within the radius of 1 camera pixel (111 nm). Gray scale represents molecular density. Vector = 100 nm/s (Frost et al., 2010). (C) (Left) sptPALM image of a DNA-binding protein, DNA polymerase I (Pol), in E. coli cells in the presence of methyl methanesulfonate (MMS). A photoactivatable fluorescent protein PAmCherry is fused to Pol. Inset shows examples of tracks of diffusing Pol (blue) and bound Pol (red); (right) distribution of diffusion coefficient for Pol under constant MMS treatment (Uphoff et al., 2013). Reproduced with permission from Manley et al. (2008), copyright 2008, Nature Publishing Group (A), Frost et al. (2010), copyright 2010, Elsevier (B), and Uphoff et al. (2013), copyright 2013, National Academy of Science, USA (C).
Figure 5
Figure 5
Super-resolution fluorescence imaging of catalytic reactions. (A) (Left) schematic illustration of the strategy for monitoring individual epoxidation reaction events catalyzed by mesoporous titanosilicates, Ti-MCM-41. The active sites are fluorescently visualized and localized by the catalytic reaction-induced color conversion of the fluorophore; (right) localization microscopy image of individual turnover. The red dots show positions of fluorescent spots originating from individual product molecules (De Cremer et al., 2010). (B) Super-resolution imaging of deacetylation reaction catalyzed by Au@mSiO2 nanorod. The positions of the reaction product on the nanorod are visualized by localization microscopy and plotted in the 2D histogram, which shows the position-dependent catalytic activity (Zhou et al., 2012). Reproduced with permission from De Cremer et al. (2010), copyright 2010, Wiley (A), and Zhou et al. (2012), copyright 2012, Nature Publishing Group (B).
Figure 6
Figure 6
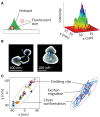
Super-resolution imaging of optical properties of nanoscale architectures. (A) Super-resolution imaging of local electromagnetic field enhancement. (Left) principle of Brownian motion super-resolution imaging; (right) super-resolution image of a hotspot on the surface of an aluminum film (Cang et al., 2011). (B) Super-resolution image of SERS signal of rhodamine 6G dyes adsorbed at gap between two silver nanoparticles. Overlay of the SERS spatial intensity map (colored pixels) and luminescent centroid (white ×) with an SEM image of silver nanoparticle aggregate (Weber et al., 2012). (C) (Left) schematic illustration nanoscale photophysical processes occurring in a single conjugated polymer molecule. (Right) 2D spatial map of emitting sites within a single conjugate polymer chain; reproduced with permission from Cang et al. (2011), copyright 2011, Nature Publishing Group (A), Weber et al. (2012), copyright 2012, American Chemical Society (B), Habuchi et al. (2011), copyright 2011, PCCP Owner Societies (C).
Figure 7
Figure 7
Super-resolution imaging of proton concentration in a nanochannel. pH profile in a 410 nm width nanochannel determined by the spatial intensity map of fluorescence intensity of fluorescein dye (Kazoe et al., 2011). Reproduced with permission from Kazoe et al. (2011), copyright 2011, American Chemical Society.

Similar articles

Cited by

References

    1. Adam V., Lelimousin M., Boehme S., Desfonds G., Nienhaus K., Field M. J., et al. (2008). Structural characterization of IrisFP, an optical highlighter undergoing multiple photo-induced transformations. Proc. Natl. Acad. Sci. U.S.A. 105, 18343–1834810.1073/pnas.0805949105 - DOI - PMC - PubMed
    1. Adam V., Moeyaert B., David C. C., Mizuno H., Lelimousin M., Dedecker P., et al. (2011). Rational design of photoconvertible and biphotochromic fluorescent proteins for advanced microscopy applications. Chem. Biol. 18, 1241–125110.1016/j.chembiol.2011.08.007 - DOI - PubMed
    1. Ando R., Hama H., Yamamoto-Hino M., Mizuno H., Miyawaki A. (2002). An optical marker based on the UV-induced green-to-red photoconversion of a fluorescent protein. Proc. Natl. Acad. Sci. U.S.A. 99, 12651–1265610.1073/pnas.202320599 - DOI - PMC - PubMed
    1. Ando R., Mizuno H., Miyawaki A. (2004). Regulated fast nucleocytoplasmic shuttling observed by reversible protein highlighting. Science 306, 1370–137310.1126/science.1102506 - DOI - PubMed
    1. Andoy N. M., Zhou X., Choudhary E., Shen H., Liu G., Chen P. (2013). Single-molecule catalysis mapping quantifies site-specific activity and uncovers radial activity gradient on single 2D nanocrystals. J. Am. Chem. Soc. 135, 1845–185210.1021/ja309948y - DOI - PubMed