. 2014 Aug 15;5(15):5934-49.
doi: 10.18632/oncotarget.1904.

Nuclear HER4 mediates acquired resistance to trastuzumab and is associated with poor outcome in HER2 positive breast cancer

Affiliations

Nuclear HER4 mediates acquired resistance to trastuzumab and is associated with poor outcome in HER2 positive breast cancer

Siti Norasikin Mohd Nafi et al. Oncotarget. .

Abstract

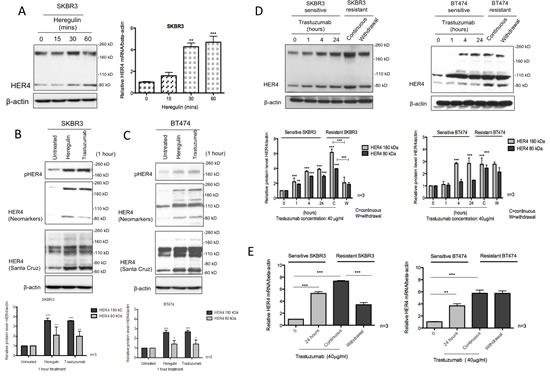
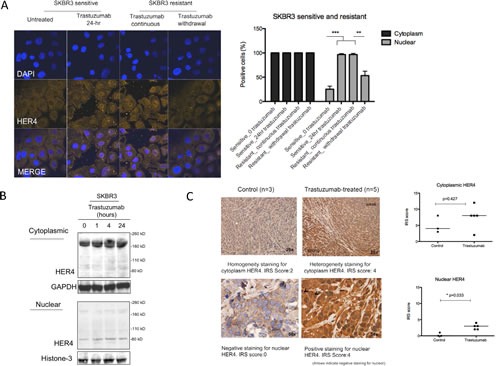
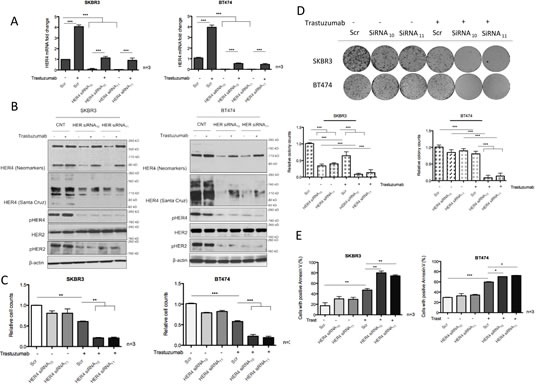
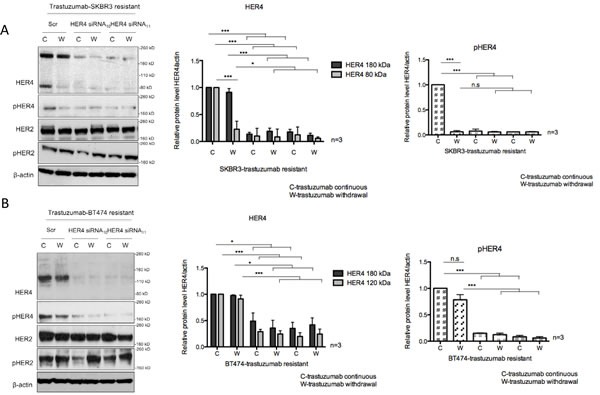
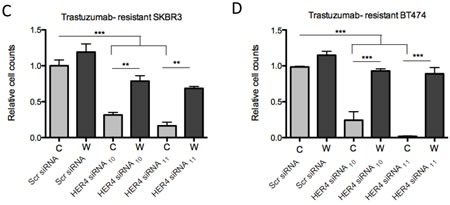
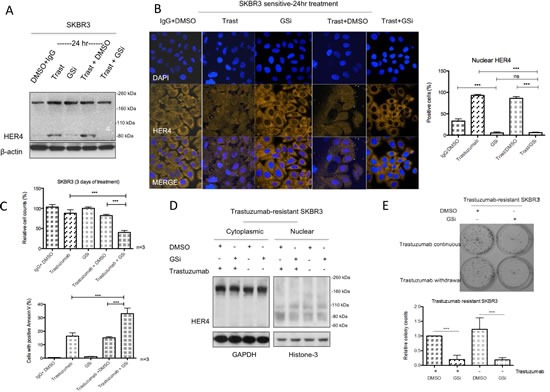
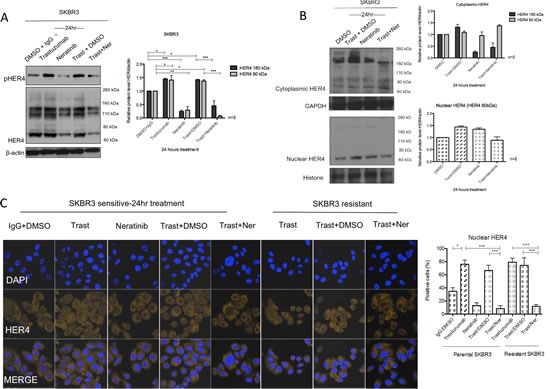
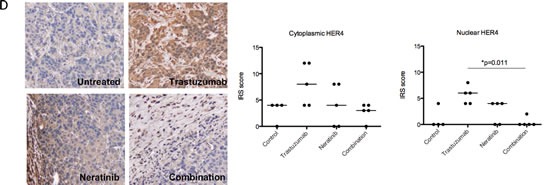
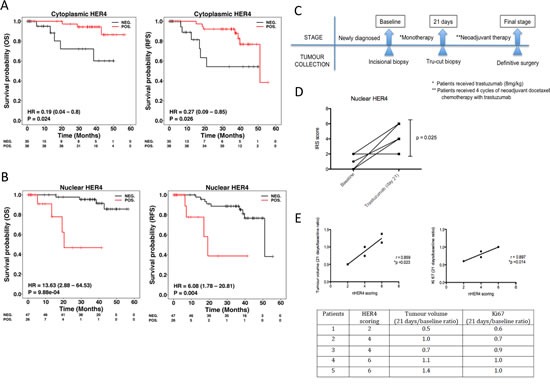
The role of HER4 in breast cancer is controversial and its role in relation to trastuzumab resistance remains unclear. We showed that trastuzumab treatment and its acquired resistance induced HER4 upregulation, cleavage and nuclear translocation. However, knockdown of HER4 by specific siRNAs increased trastuzumab sensitivity and reversed its resistance in HER2 positive breast cancer cells. Preventing HER4 cleavage by a γ-secretase inhibitor and inhibiting HER4 tyrosine kinase activity by neratinib decreased trastuzumab-induced HER4 nuclear translocation and enhanced trastuzumab response. There was also increased nuclear HER4 staining in the tumours from BT474 xenograft mice and human patients treated with trastuzumab. Furthermore, nuclear HER4 predicted poor clinical response to trastuzumab monotherapy in patients undergoing a window study and was shown to be an independent poor prognostic factor in HER2 positive breast cancer. Our data suggest that HER4 plays a key role in relation to trastuzumab resistance in HER2 positive breast cancer. Therefore, our study provides novel findings that HER4 activation, cleavage and nuclear translocation influence trastuzumab sensitivity and resistance in HER2 positive breast cancer. Nuclear HER4 could be a potential prognostic and predictive biomarker and understanding the role of HER4 may provide strategies to overcome trastuzumab resistance in HER2 positive breast cancer.


Figures

Figure 1
Figure 1. HER4 expression is upregulated following heregulin stimulation and trastuzumab treatment
(A) The left panel shows the western blot of HER4 after 100ng/ml heregulin stimulation at different time points in SKBR3 cells. Right, SKBR3 cells were stimulated with 100ng/ml heregulin and HER4 expression was assessed by RT-PCR. HER4 mRNA of each group was quantified relative to the untreated cells, and normalised to β-actin. (B & C) SKBR3 and BT474 cells were treated with 40μg/ml trastuzumab or stimulated with 100ng/ml heregulin for one-hour before western blot analysis for the indicated proteins. Two different anti-HER4 antibodies, HER4 (Neomarkers) and HER4 C18 (Santa Cruz: SC283) were used. The quantification of HER4 protein level was done for anti-HER4 antibody from Neomarkers after normalised to β-actin (bottom panels). Means ± SD from three independent experiments are shown in the graph (*p<0.05, **p<0.01, ***p<0.001). (D) The figures show the representative western blots (upper panels) of HER4 and their quantification (lower panels) from sensitive SKBR3 and BT474 cells treated with 40μg/ml trastuzumab at 0, 1, 4 and 24 hours in comparison with trastuzumab-resistant cells (with or without trastuzumab 24 hr withdrawal). The resistant cell lines were previously generated by a continuous treatment with 40μg/ml trastuzumab for more than 8 months [23]. (E) HER4 mRNA levels of sensitive and trastuzumab resistant SKBR3 and BT474 cells were measured. β-actin mRNA was used for normalization and the quantification was relative to the untreated cells. The means of HER4 mRNA ± SD from three independent experiments are shown in the graph (**p<0.01, ***p<0.001).
Figure 2
Figure 2. Nuclear HER4 localisation is induced in vitro and in vivo after trastuzumab treatment
(A) Left, representative confocal images from sensitive and acquired resistant SKBR3 cells treated with 40μg/ml trastuzumab are shown. Right, a graph shows the percentage of positive cells stained with HER4-Alexa Fluor 546 at cytoplasmic and nuclear localisation. Means ± SD from three independent experiments are shown in the graph. 1-way ANOVA test with Bonferroni's multiple comparisons was applied to determined significant differences between the groups (**p<0.01, ***P<0.001). (B) Western blot analysis was performed on the cytoplasmic and nuclear fractions of SKBR3 cells isolated using NE-PER Nuclear and Cytoplasmic Extraction kit (Thermo Scientific). After cell fractionation, GAPDH and Histone-3 levels were used as the loading control for cytoplasm fraction and nuclear fraction respectively. (C) Left, HER4 staining by IHC in untreated and trastuzumab treated BT474 xenografts. The xenografts consist of mice treated with either trastuzumab or control for two weeks [24]. HER4 expression was scored semiquantitatively using the immunoreactive score (IRS) as described in the methods. Right, the cytoplasmic and nuclear HER4 scorings of trastuzumab-treated and the control groups are presented in a graph. Mann-Whitney test was used to determine the difference in median IRS scores between the untreated and trastuzumab-treated group. The statistical significance was denoted as * p<0.05.
Figure 3
Figure 3. HER4 silencing decreases cell viability and enhances trastuzumab responses
(A) SKBR3 and BT474 cells were transfected with HER4 siRNA10 and siRNA11, with and without 40μg/ml trastuzumab treatment before the mRNA levels were measured by RT-PCR. The scr (scramble) siRNA was used to normalize for transfection efficiency. Expression of HER4 is relative to the untreated scramble control and is normalised to β-actin. (B) Representative western blots of the indicated proteins from HER4 siRNA experiments in (A) are shown. (C) Cell count experiments were performed in SKBR3 and BT474 cells after 72-hour transfection as in (A) and the relative cell counts (normalized to the scr control) is shown in the graph. Means ± SD of three independent experiments is shown (**p<0.01 ***p<0.001). (D) The effect of HER4 siRNAs in SKBR3 and BT474 cells was further investigated in colony formation experiments after 7 days post transfection as in (A). Representative colony pictures are shown on the upper panels and the relative colony counts (means ± SD) are shown on the bottom panels. (E) SKBR3 and BT474 cells transfected with transient HER4 siRNA (with and without trastuzumab) for 72 hours were stained for Annexin V and the percentage of positive cells was assessed by FACS analysis. Means ± SD from three independent experiments are shown in the graph (*p<0.05, ***p<0.001).
Figure 4
Figure 4. HER4 silencing reverses trastuzumab resistance and decreases cell counts in trastuzumab-resistant cells
(A & B) Trastuzumab-resistant SKBR3 and BT474 cells were transfected with HER4 siRNA10 and siRNA11 in the presence (C) or withdrawal (W) of trastuzumab before western blot analysis for the indicated proteins. The middle and right panels show a relative quantification of HER4 and pHER4 levels from 3 independent experiments using Image J software. A 1-way ANOVA test with Bonferroni's multiple comparison was applied to determine significant differences between the groups (n.s=not significant, *p<0.05, ***p<0.001) (C & D) Cell count experiments were performed at 72 hr post transfection after siRNA experiments as in (A) and (B). The graphs show relative cell count relative to the scramble resistant cells. The mean ratios of cell counts ± SD from three independent experiments are shown (**p<0.01, ***p<0.001).
Figure 5
Figure 5. Gamma-secretase inhibitor prevents nuclear translocation and reverses resistance in trastuzumab-resistant cells
(A & B) SKBR3 cells were treated with 10μM γ-secretase inhibitor (GSi) with or without 40μg/ml trastuzumab before performing western blot analysis and confocal microscopy to investigate HER4 expression by IHC and localization by confocal microscopy. (C) Cell count and apoptosis assays were performed after treatments as in (A) and (B). Means ± SD from three independent experiments are shown (***p<0.001). (D) Figures show the representative HER4 immunoblots on cytoplasmic and nuclear fractions from trastuzumab-resistant SKBR3 cells treated with GSi. (E) The effect of GSi on trastuzumab-resistant SKBR3 was studied using colony formation assay. Representative colony pictures are shown on the upper panel and the relative ratio of colony counts are shown on the bottom panel.
Figure 6
Figure 6. Neratinib prevents nuclear HER4 translocation induced by trastuzumab in vitro and in vivo
(A) SKBR3 cells were treated with 100 nM neratinib or/and 40μg/ml trastuzumab for 24 hours before western blot analysis for the indicated proteins. (B) Western blot analysis was performed on the cytoplasmic and nuclear fractions of SKBR3 cells after treatments in (A). On the left panels, the representative blots are shown. The right panels show a relative quantification of HER4 and pHER4 from 2 independent experiments using Image J software. Although multiple independent experiments were done, only two experiments provided adequate quality of HER4 immunoblot for quantification. (C) Sensitive and resistant SKBR3 cells were treated with 100 nM neratinib and/or 40μg/ml trastuzumab before being fixed for confocal microscopy. Representative confocal images from different treatment conditions are shown on the upper panel. The right panel shows the percentage of positive cells stained with HER4-Alexa Fluor 546 at nuclear localisation. Means ± SD from three independent experiments are shown in the graph. 1-way ANOVA test with Bonferroni's multiple comparisons was applied to determined significant differences between the groups (*p<0.05, ***p<0.001).(D) BT474 xenografts were treated with vehicle control, neratinib, trastuzumab or their combination [28] and the tumour slides were stained for HER4 expression using IHC. Representative tumour sections from formalin-fixed, paraffin embedded tumour tissues of animals receiving different treatments are shown in the left panels. The IRS scores of HER4 immunohistochemical staining of cytoplasmic and nuclear localisation of the tumours are shown in the right panels. Kruskal-Wallis with Dunn's multiple comparisons test was used to determine the difference in median IRS scores between the treatment groups (*P<0.05).
Figure 7
Figure 7. Nuclear HER4 predicts poorer trastuzumab response and is an adverse prognostic marker in HER2 positive breast cancer patients
(A & B) TMAs containing paraffin embedded breast tumours from a well-annotated HER2 positive breast cancer patients were stained for HER4 expression by IHC. Patients were split into two groups according to the positive and negative cytoplasmic and nuclear HER4 staining as defined in the methods section. The relapse-free survival and overall survival of the two groups were plotted in Kaplan-Meier curves according to the cytoplasmic and nuclear HER4 staining in breast cancer patients (n=73). (C) A schematic diagram shows a window of opportunity study conducted among HER2 positive breast cancer patients who received trastuzumab monotherapy followed by neoadjuvant chemotherapy with trastuzumab before surgery. Tumour specimens were collected at the baseline, 21 days after trastuzumab monotherapy and at the final stage after completed 4 cycles of neoadjuvant docetaxel chemotherapy 100 mg/m2 with 6mg/kg trastuzumab. (D) Nuclear HER4 expression was analysed using IHC in paired tissue samples (baseline and at 21 days) from 5 patients who received one dose of trastuzumab monotherapy. The differences in HER4 IRS scores between the pairs were asssesed by paired t-test (* indicates p<0.05). (E) Nuclear HER4 expression at day 21 was correlated with the ratios of tumour volumes and Ki67 stainings (between day 21 and baseline) using linear regression (upper panels). The table below shows the HER4 scorings of the individual 5 patients with their respective tumour volume and Ki67 ratios.

References

    1. Muraoka-Cook RS, Feng SM, Strunk KE, Earp HS., 3rd ErbB4/HER4: role in mammary gland development, differentiation and growth inhibition. J Mammary Gland Biol Neoplasia. 2008;13:235–246. - PMC - PubMed
    1. Koutras AK, Fountzilas G, Kalogeras KT, Starakis I, Iconomou G, Kalofonos HP. The upgraded role of HER3 and HER4 receptors in breast cancer. Crit Rev Oncol Hematol. 2010;74:73–78. - PubMed
    1. Carpenter G. ErbB-4: mechanism of action and biology. Exp Cell Res. 2003;284:66–77. - PubMed
    1. Zhou W, Carpenter G. Heregulin-dependent trafficking and cleavage of ErbB-4. J Biol Chem. 2000;275:34737–34743. - PubMed
    1. Carraway KL, 3rd, Weber JL, Unger MJ, Ledesma J, Yu N, Gassmann M, Lai C. Neuregulin-2, a new ligand of ErbB3/ErbB4-receptor tyrosine kinases. Nature. 1997;387:512–516. - PubMed

Publication types