. 2014 Aug 15;5(15):6229-42.
doi: 10.18632/oncotarget.2190.

The Aurora-A inhibitor MLN8237 affects multiple mitotic processes and induces dose-dependent mitotic abnormalities and aneuploidy

Affiliations

The Aurora-A inhibitor MLN8237 affects multiple mitotic processes and induces dose-dependent mitotic abnormalities and aneuploidy

Italia Anna Asteriti et al. Oncotarget. .

Abstract

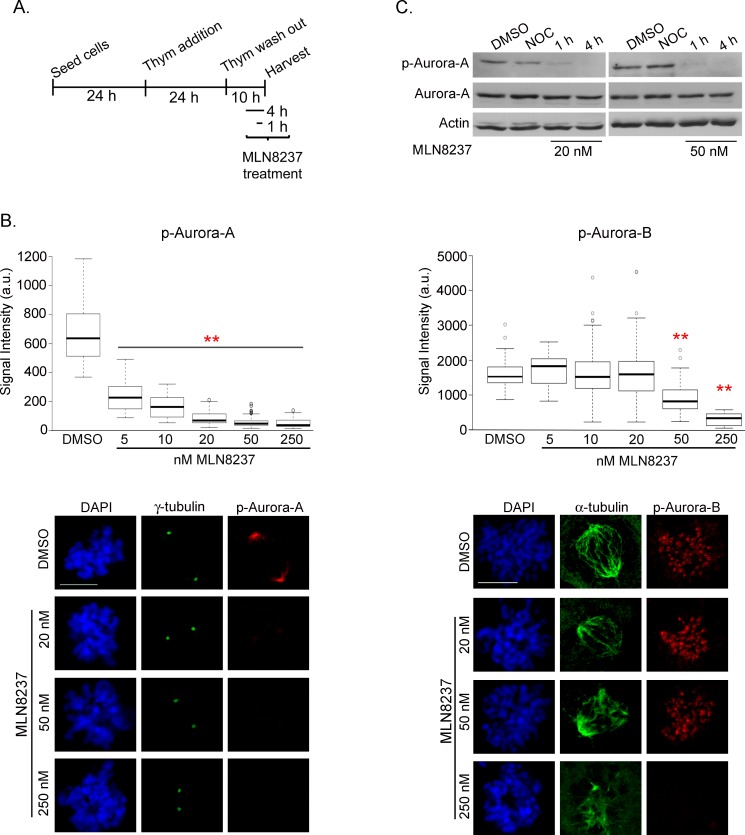
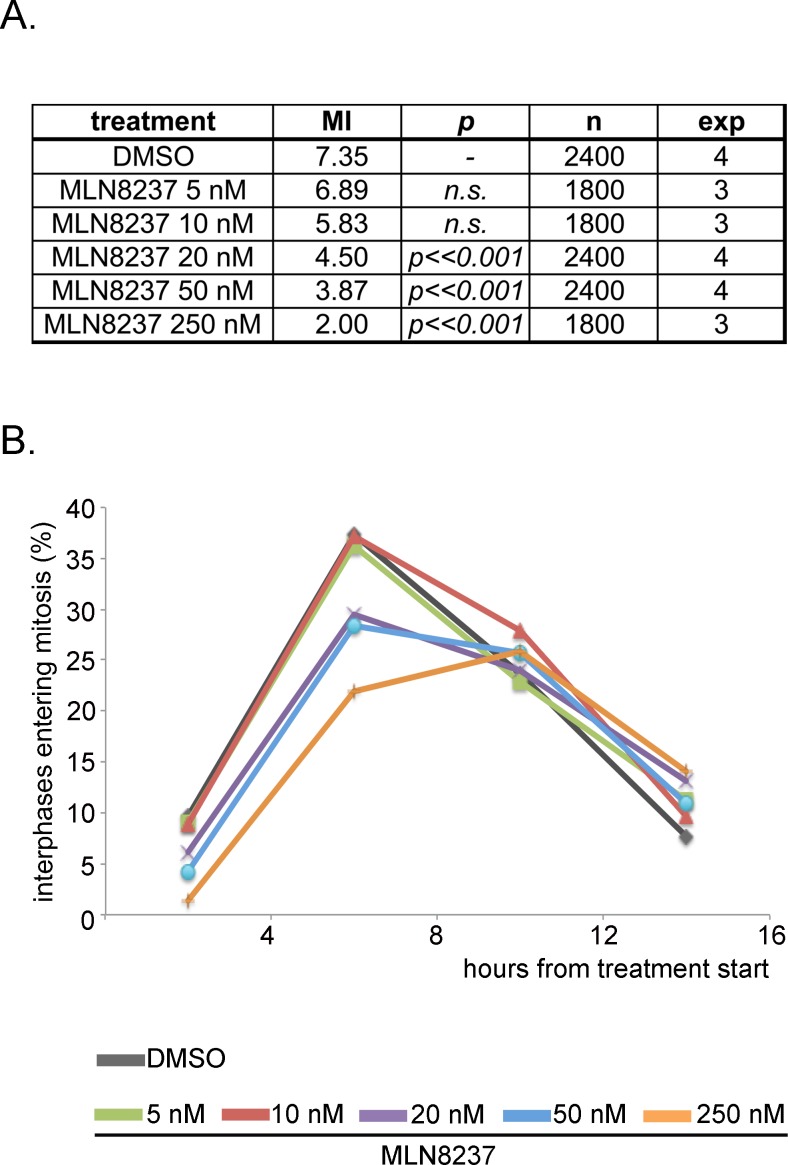
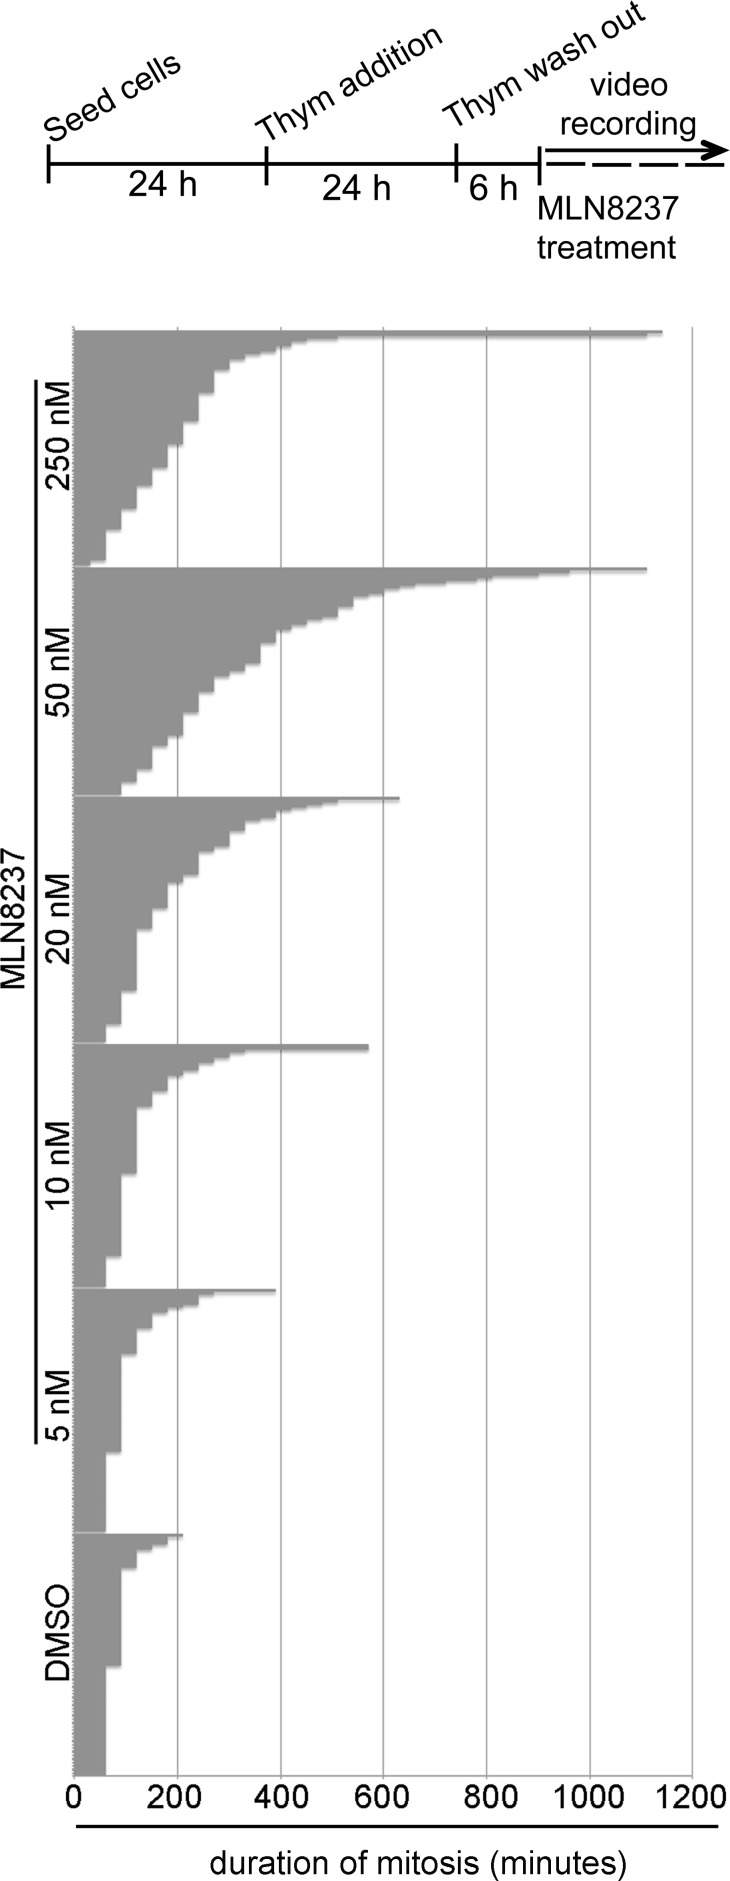
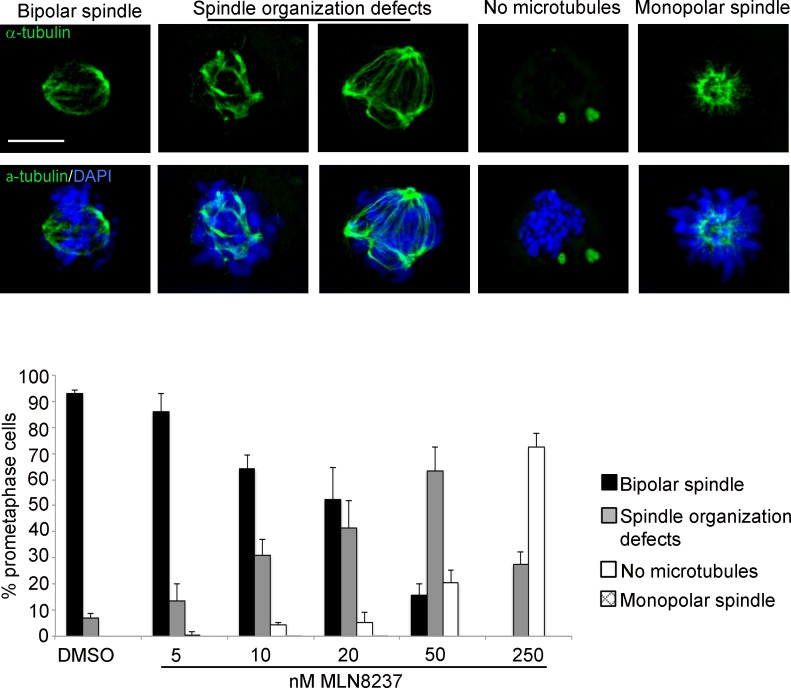
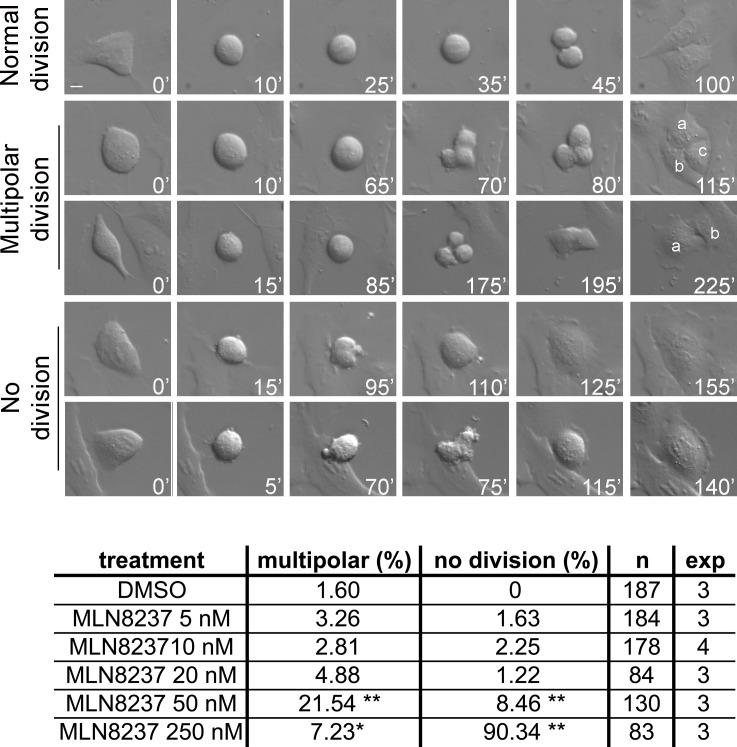
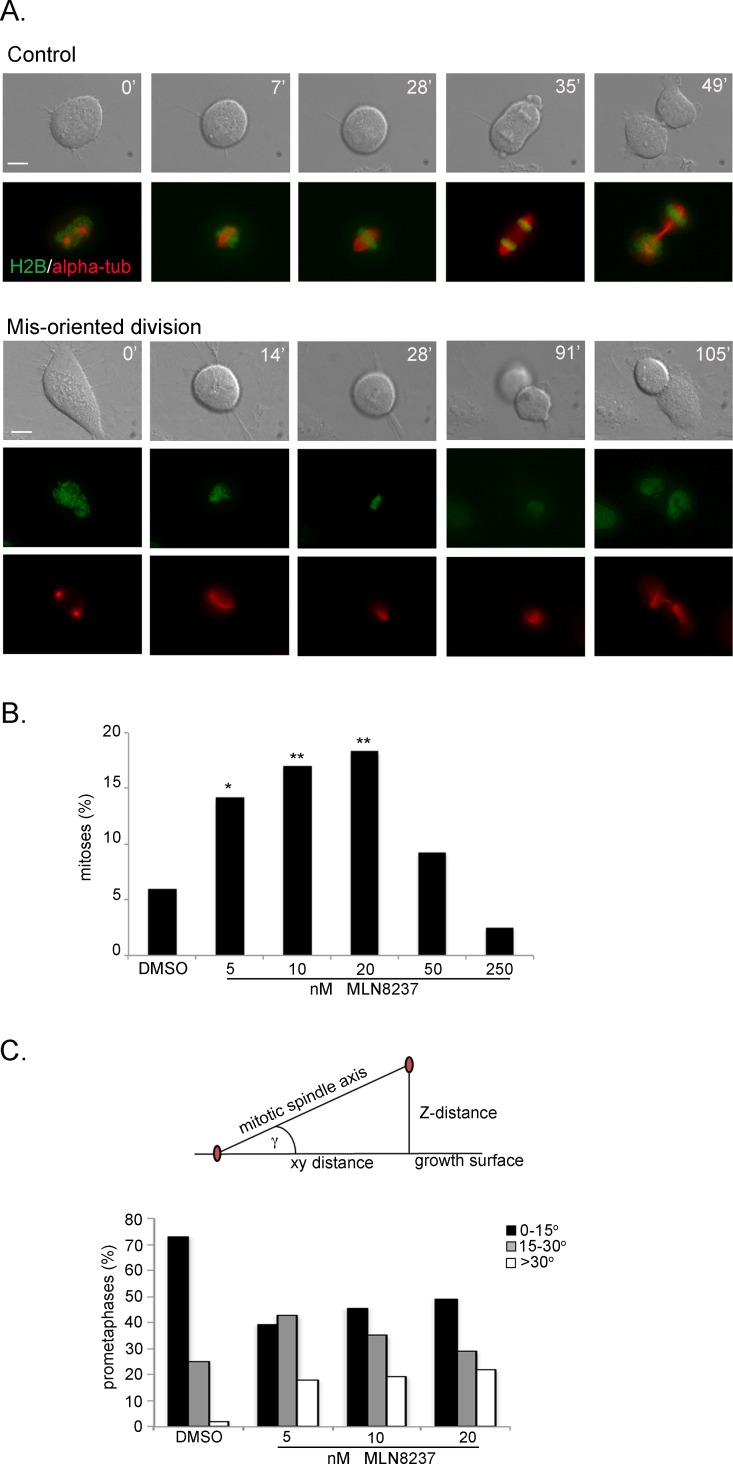
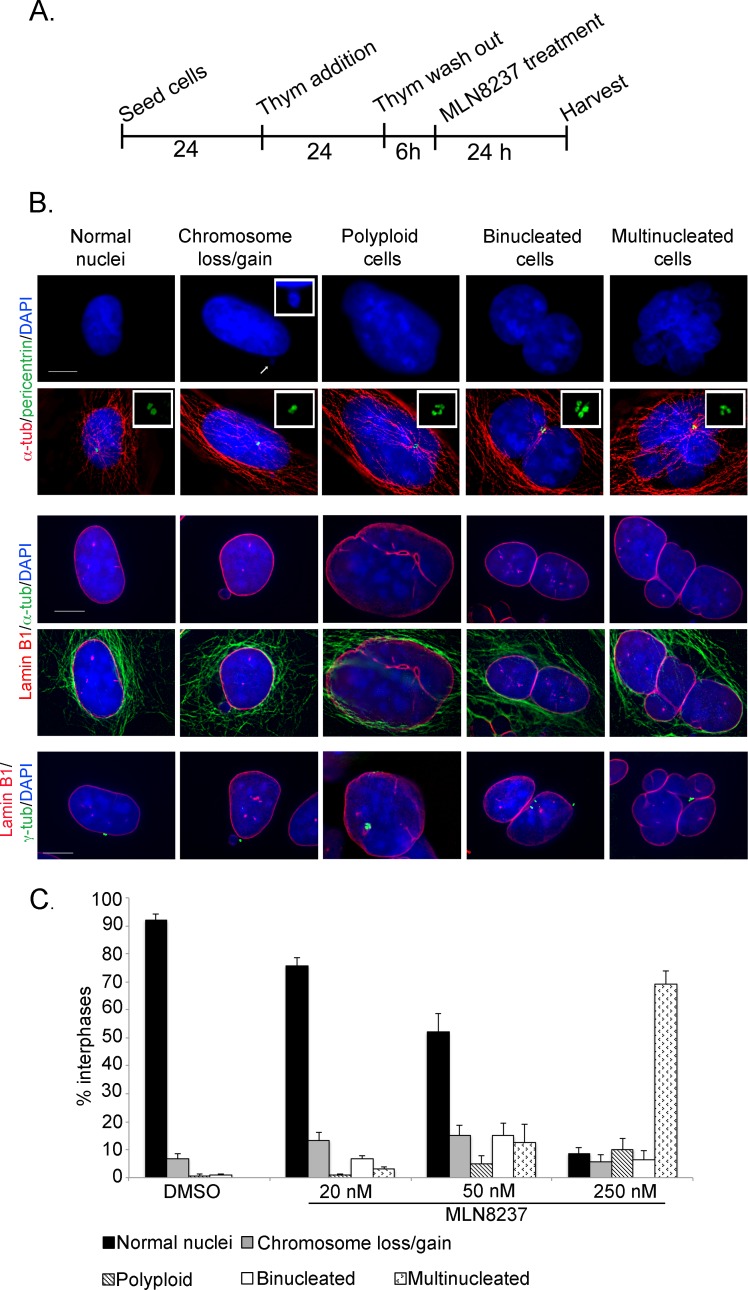
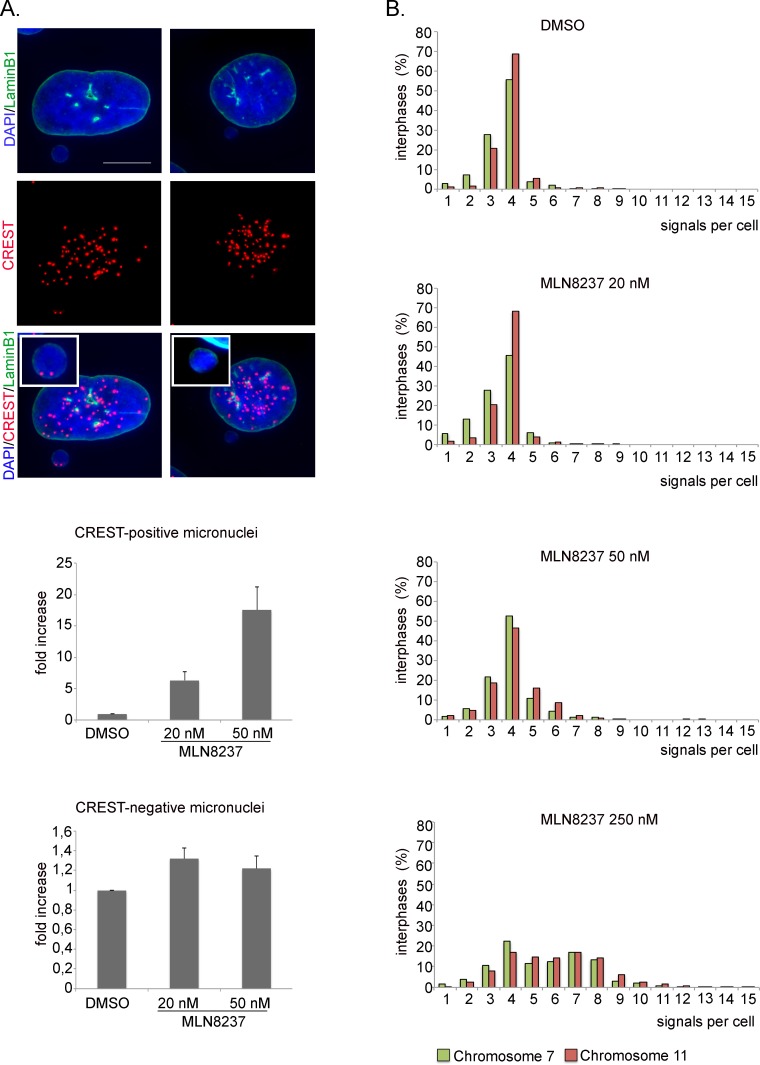
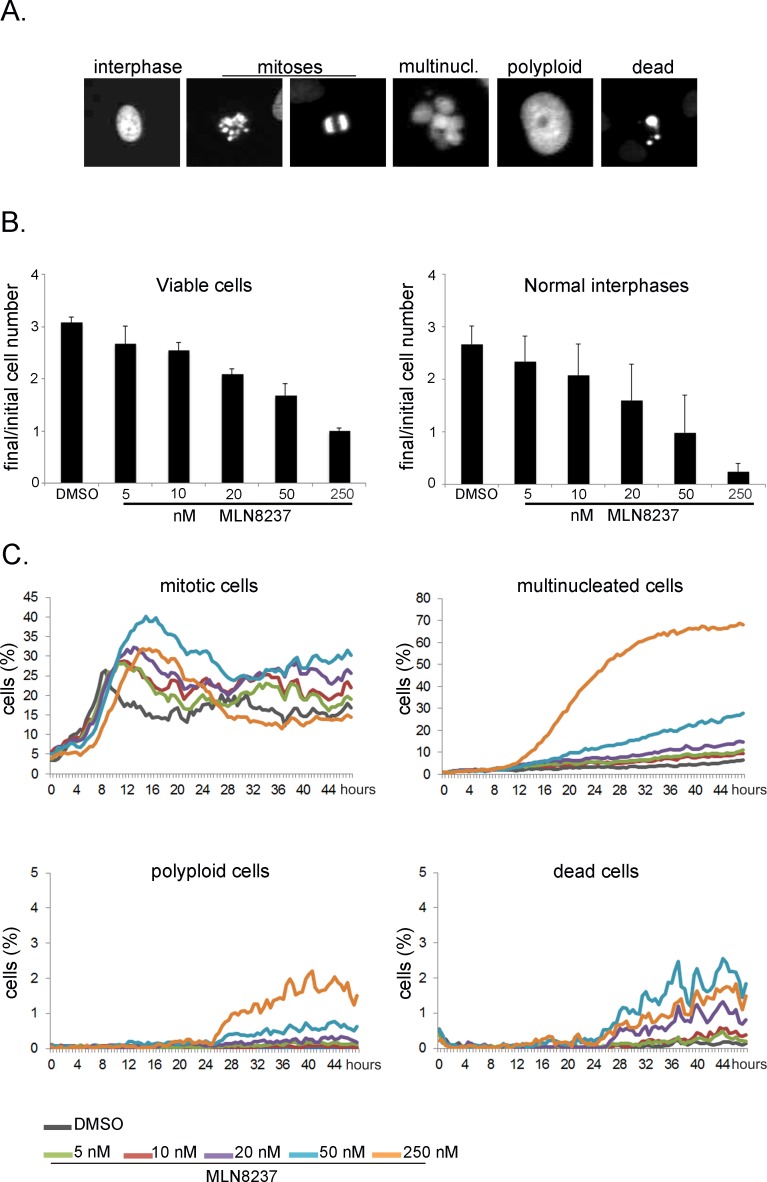
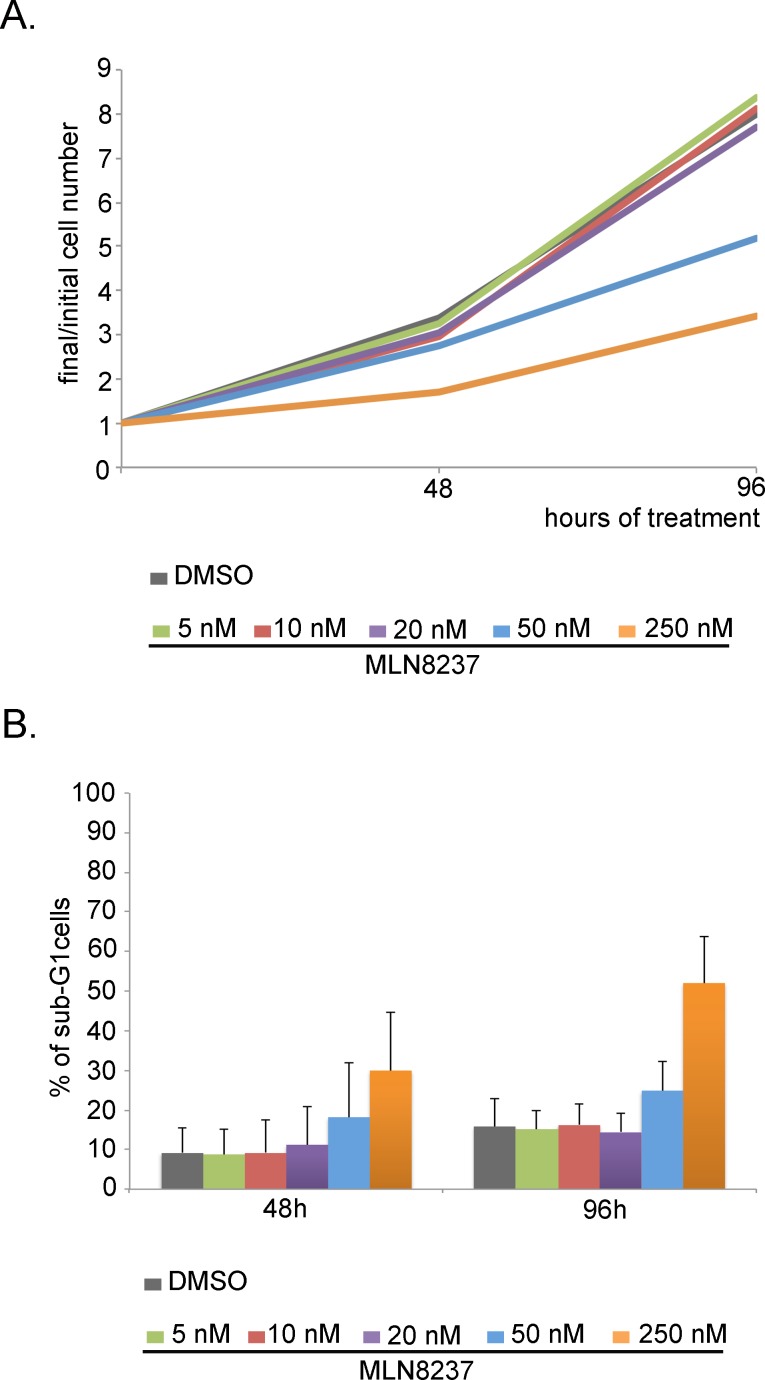
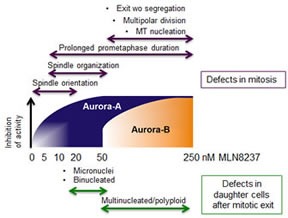
Inhibition of Aurora kinase activity by small molecules is being actively investigated as a potential anti-cancer strategy. A successful therapeutic use of Aurora inhibitors relies on a comprehensive understanding of the effects of inactivating Aurora kinases on cell division, a challenging aim given the pleiotropic roles of those kinases during mitosis. Here we have used the Aurora-A inhibitor MLN8237, currently under phase-I/III clinical trials, in dose-response assays in U2OS human cancer cells synchronously proceeding towards mitosis. By following the behaviour and fate of single Aurora-inhibited cells in mitosis by live microscopy, we show that MLN8237 treatment affects multiple processes that are differentially sensitive to the loss of Aurora-A function. A role of Aurora-A in controlling the orientation of cell division emerges. MLN8237 treatment, even in high doses, fails to induce efficient elimination of dividing cells, or of their progeny, while inducing significant aneuploidy in daughter cells. The results of single-cell analyses show a complex cellular response to MLN8237 and evidence that its effects are strongly dose-dependent: these issues deserve consideration in the light of the design of strategies to kill cancer cells via inhibition of Aurora kinases.


Figures

Figure 1
Figure 1. Dose-dependent inhibition of Aurora-A and Aurora-B by MLN8237
A. Protocol for MLN8237 treatment in cells progressing towards mitosis after thymidine (Thym) arrest and release. B. Quantification of IF signals for active pThr288-Aurora-A (left, mean intensity at poles) or active pThr232-Aurora-B (right, sum intensity at chromosomes) in control (DMSO) or MLN8237-treated prometaphases is shown in the box-plots (center lines show the medians; box limits indicate the 25th and 75th percentiles as determined by R software; whiskers extend 1.5 times the interquartile range from the 25th and 75th percentiles, outliers are represented by dots). Fluorescence intensity is shown in arbitrary units (a.u.). **: p<0.0001, unpaired t test or Mann-Whitney test. n=90 spindle poles (p-Aurora-A) or 50 prometaphases (p-Aurora-B) from 3 experiments. Representative IF images are shown. Scale bars: 10 μm. C. p-Aurora-A (active) levels decrease in mitotic extracts (shake-off) from MLN8237-treated (1 or 4 hours before harvesting) compared to DMSO- or nocodazole (NOC)-treated (4 hours) U2OS cultures. Total Aurora-A levels are also shown; actin is used as loading control. p-Aurora-B was not assessed in Western blot due to the lack of a suitable antibody for this application.
Figure 2
Figure 2. MLN8237 delays entry into mitosis
A. Mitotic index (MI) from control (DMSO) and MLN8237-treated cultures (protocol as in Figure 1A), as assessed by DAPI (DNA) and alpha-tubulin (spindle) staining. p values (χ2 test) relative to control cultures, number of scored cells (n) and of independent experiments (exp) are indicated. B. Control (DMSO) and MLN8237-treated cultures were recorded by time-lapse imaging from the treatment start for the following 16 hours. The graph shows the percentage of interphases entering mitosis during the recording period; results are grouped in 4-hours intervals. 250 recorded interphases in 3 experiments for each condition.
Figure 3
Figure 3. Dose-dependent lengthening of mitosis in MLN8237-treated cultures
The protocol for time-lapse recording of MLN8237-treated cultures progressing towards mitosis from thymidine (Thym) arrest and release is depicted on top. Phase-contrast microscopy images were acquired with a 10x objective every 30 minutes. Duration of mitosis is calculated from round-up to visualization of 2 distinct daughter cells; each bar represents a mitotic cell. At least 90 cells per condition are displayed from 3 experiments.
Figure 4
Figure 4. Spindle defects in MLN8237-treated mitoses
Cultures harvested 4 hours after MLN8237 treatment (protocol as in Figure 1A) were stained for DNA and alpha-tubulin. Histograms represent the percentage of prometaphases displaying normal or defective spindles (IF panels on top). 250-300 counted cells per condition from 3 experiments; s.d. are shown. Scale bar: 10 μm.
Figure 5
Figure 5. Time-lapse analysis of MLN8237-treated mitoses reveals multipolar and “no division” phenotypes
Cultures treated as in the protocol in Figure 3 were recorded by time-lapse from treatment start for the following 24 hours. DIC images were acquired with a 40x objective every 5 minutes; representative single photograms are shown; time from round-up is indicated. First row: normal mitosis; second and third rows: multipolar mitoses (a, b and c indicate daughter cells); fourth and fifth rows: mitoses passing directly from prometaphase to defective interphase, with (lower) or without (upper) a “blebbing” phase. Defects are quantified (%) in the table below; number of recorded mitoses (n) and independent experiments per condition are indicated. *: 0.01
Figure 6
Figure 6. Aurora-A inhibition induces mis-oriented cell division
A. An example of normally dividing cell is shown on top. Mis-oriented division in the presence of MLN8237 in U2OS cells with fluorescently labeled H2B (green) and alpha-tubulin (red) is shown below. Minutes from round-up are indicated. Scale bars: 10 μm. B. Quantification (%) of mis-oriented cell division recorded from MLN8237 treatment start for the following 20 hours (80-200 mitoses per condition from 3-4 independent experiments). *: 0.012 test. C. The angle between the growth surface and the centrosome-centrosome axis in MLN8237-treated mitoses is calculated as schematized on top (centrosomes are in red; see Methods for details); histograms represent the distribution of prometaphases in 3 classes (50-60 cells from 3 independent experiments).
Figure 7
Figure 7. Outcome of mitoses treated with the MLN8237 inhibitor
A. Schematization of the protocol for the analysis of the progeny of MLN8237-treated mitoses. B. The IF panels show different scored categories. Markers and color codes for DNA, MTs, nuclear envelope and centrosomes are indicated on the left. In the upper panels, the inset in the DAPI channel shows an enlargement of a micronucleus, while insets in the merged images show enlargements of centrosomes. Scale bars: 10 μm. C. Histograms represent the occurrence (%) of defects in B. At least 1000 cells per condition were counted in 3 experiments; s.d. are shown.
Figure 8
Figure 8. Ploidy alteration in MLN8237-treated cells
A. IF images of CREST-positive (left panels) or -negative (right panels) micronuclei. The insets show enlargements of micronuclei. Histograms represent interphases with CREST-positive or -negative micronuclei in MLN8237-treated cultures (fold-increase relative to controls). 400 cells per condition were counted from 4 experiments. s.d. are shown. Scale bar: 10 μm. B. Distribution of interphases with different numbers of signals for chromosomes 7 and 11 (FISH hybridization). 800-1000 cells per condition were counted in 2 experiments.
Figure 9
Figure 9. Long-term high-throughput analysis of MLN8237-treated cultures
Cultures treated as in Fig. 3 were recorded for 48 hours. Automated segmentation and classification on the images was performed using the CellCognition software. A. Classes defined for training the classifier are shown with representative examples for each class. B. Histograms on the left represent the increase in the number of viable cells from the first to the last frame of the acquisition. Average values and s.d. of 10 replicates from 3 independent experiments are shown. The analyzed sample size at time 0 was at least 500 cells per replicate. Histograms on the right represent the increase in normal interphases only under the same conditions. C. The line charts represent the percentage of cells per class during the recording time.
Figure 10
Figure 10. Dose-dependent effects of MLN8237 on cell growth and viability
A. Cells were counted after 48 and 96 hours from MLN8237 treatment start. Values represent the increase in the number of cells respect to t=0h (3 independent experiments). B. The percentage of sub-G1 cells in MLN8237-treated cultures, detected by FACS analysis, is shown in the histograms (3 experiments). s.d. are shown.
Figure 11
Figure 11. Dose-dependent effects of MLN8237 on cell division and aneuploidy induction: a schematic overview
Schematic representation of the phenotype distribution (Up: mitotic defects. Low: abnormal daughter interphases) along a MLN8237 concentration gradient in U2OS cells. Gradual inhibition of Aurora-A (blue) and Aurora-B (orange) is indicated by the gradients within shapes (dose intervals are not in scale); note that at 20 nM MLN8237 Aurora-A inhibition is virtually complete.

References

    1. Hirota T, Kunitoku N, Sasayama T, Marumoto T, Zhang D, Nitta M Hatakeyama K, Saya H. Aurora-A and an interacting activator, the LIM protein Ajuba, are required for mitotic commitment in human cells. Cell. 2003;114:585–598. - PubMed
    1. Marumoto T, Honda S, Hara T, Nitta M, Hirota T, Kohmura E, Saya H. Aurora-A kinase maintains the fidelity of early and late mitotic events in HeLa cells. J Biol Chem. 2003;278:51786–51795. - PubMed
    1. Katayama H, Sasai K, Kloc M, Brinkley BR, Sen S. Aurora kinase-A regulates kinetochore/chromatin associated microtubule assembly in human cells. Cell Cycle. 2008;7:2691–2704. - PubMed
    1. De Luca M, Lavia P, Guarguaglini G. A functional interplay between Aurora-A, Plk1 and TPX2 at spindle poles: Plk1 controls centrosomal localization of Aurora-A and TPX2 spindle association. Cell Cycle. 2006;5:296–303. - PubMed
    1. De Luca M, Brunetto L, Asteriti IA, Giubettini M, Lavia P, Guarguaglini G. Aurora-A and ch-TOG act in a common pathway in control of spindle pole integrity. Oncogene. 2008;27:6539–6549. - PubMed

Publication types

LinkOut - more resources