. 2014 Sep 1;206(5):671-88.
doi: 10.1083/jcb.201401072. Epub 2014 Aug 25.

BMP-regulated exosomes from Drosophila male reproductive glands reprogram female behavior

Affiliations

BMP-regulated exosomes from Drosophila male reproductive glands reprogram female behavior

Laura Corrigan et al. J Cell Biol. .

Abstract

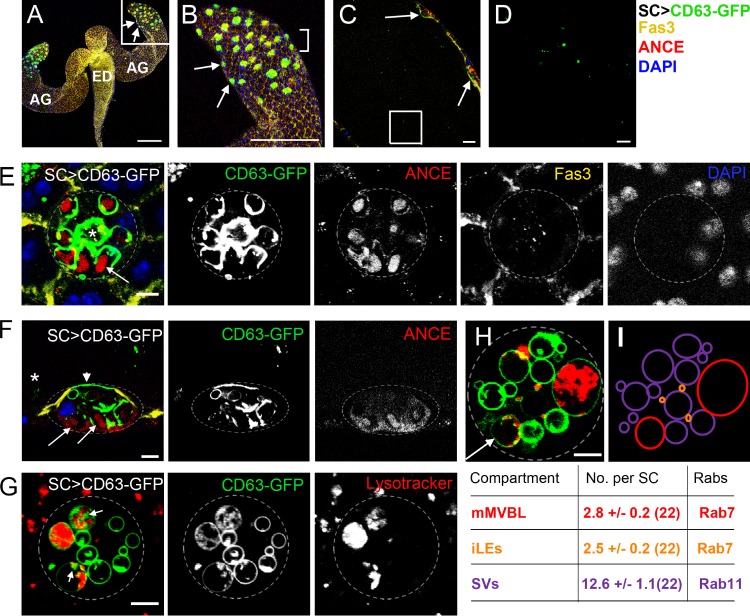
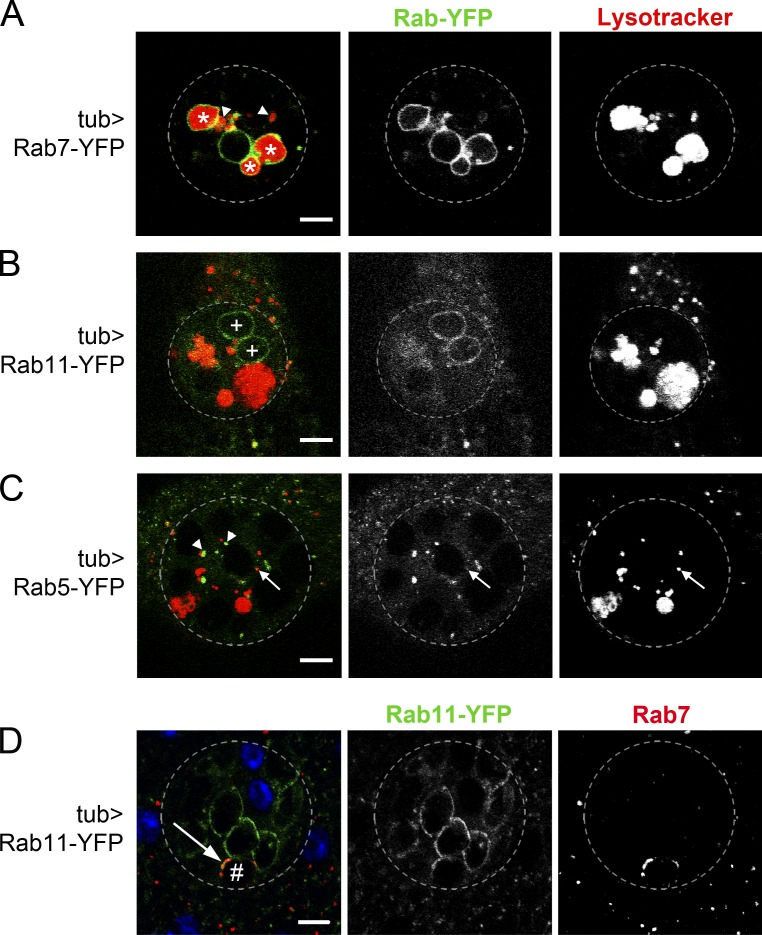
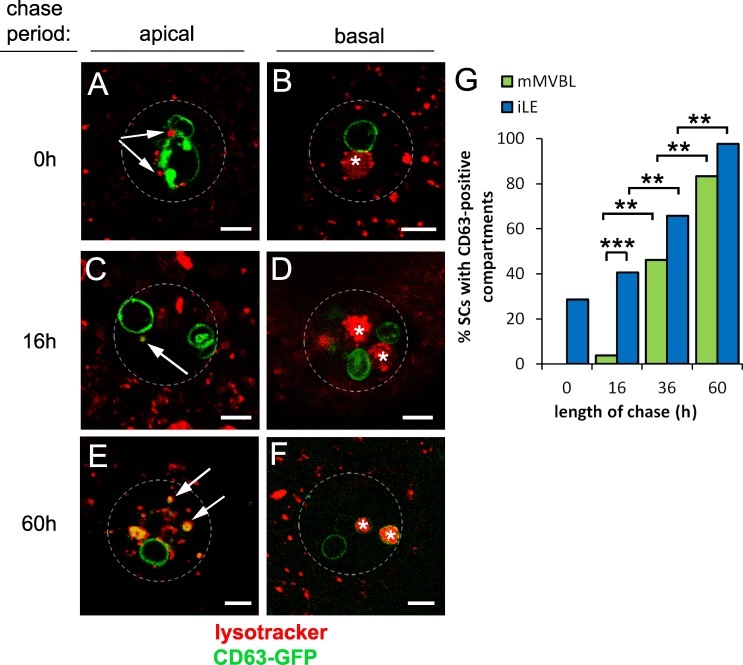
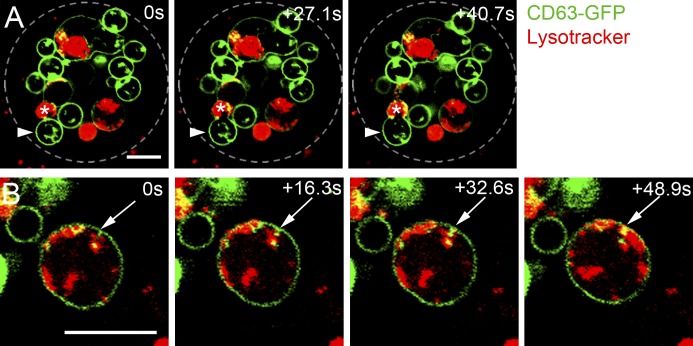
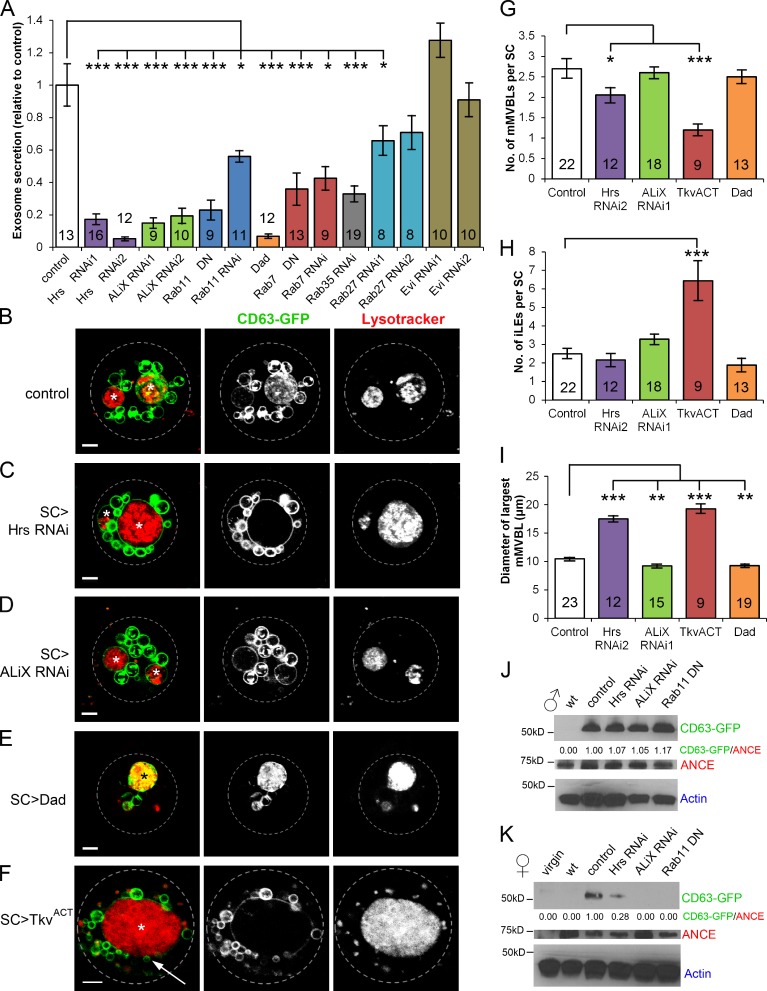
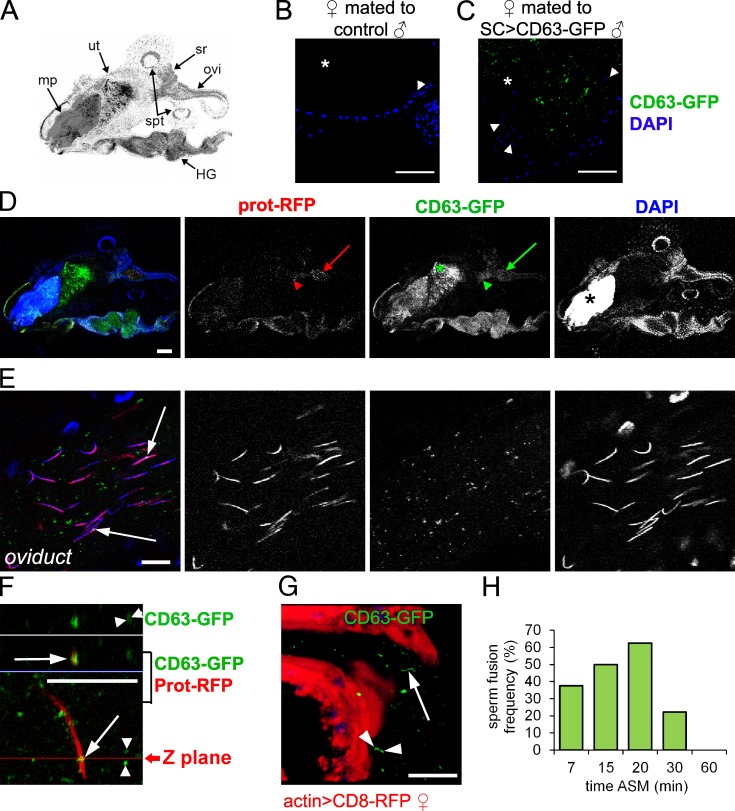
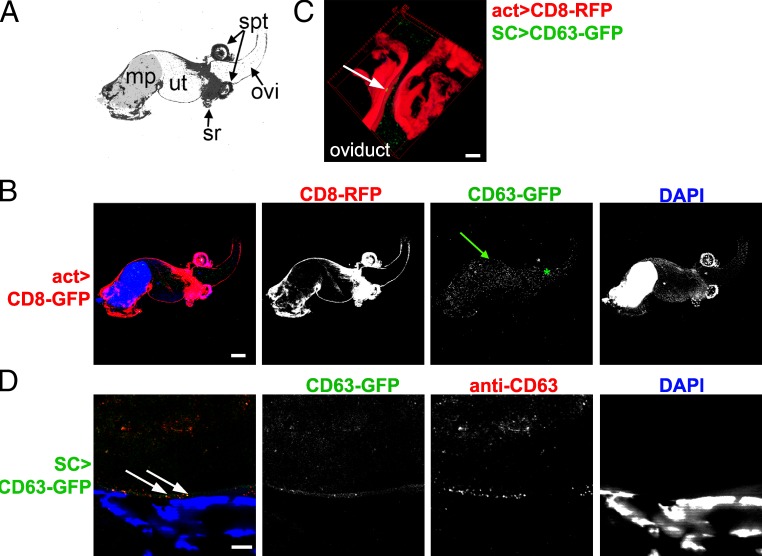
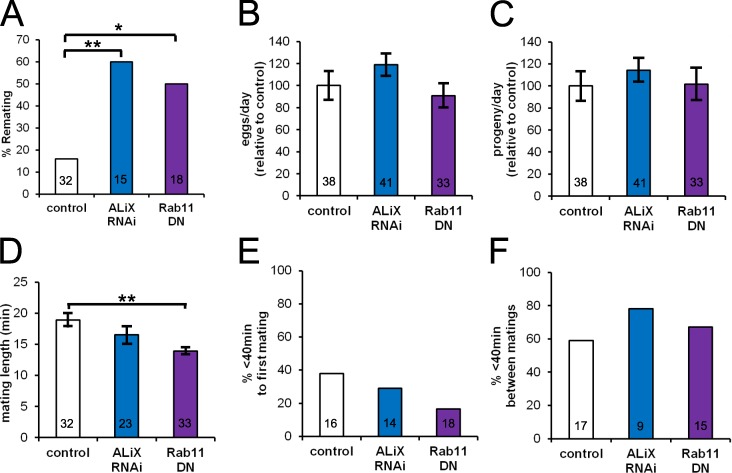
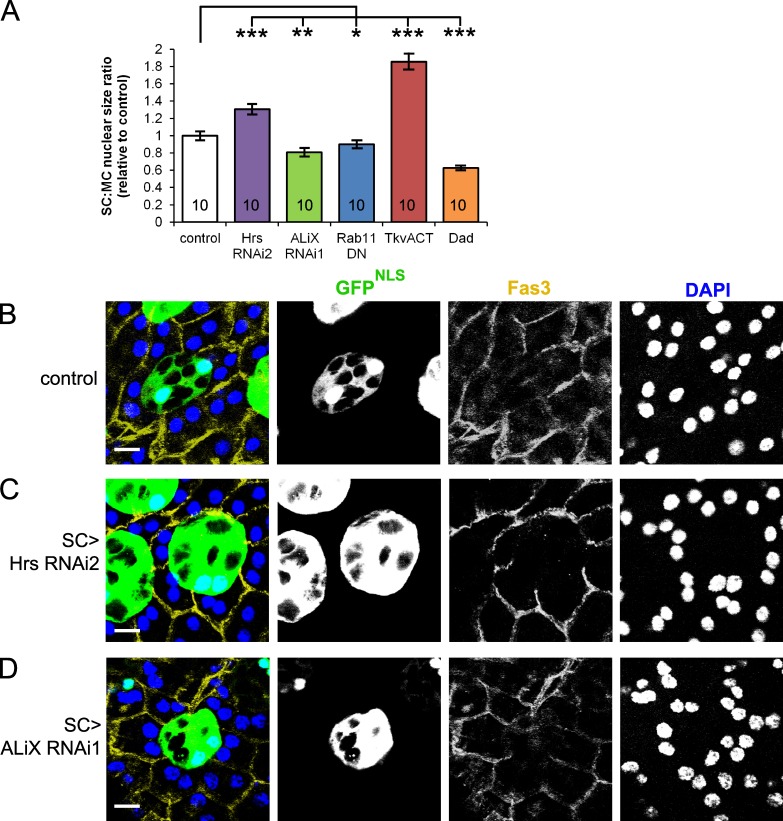
Male reproductive glands secrete signals into seminal fluid to facilitate reproductive success. In Drosophila melanogaster, these signals are generated by a variety of seminal peptides, many produced by the accessory glands (AGs). One epithelial cell type in the adult male AGs, the secondary cell (SC), grows selectively in response to bone morphogenetic protein (BMP) signaling. This signaling is involved in blocking the rapid remating of mated females, which contributes to the reproductive advantage of the first male to mate. In this paper, we show that SCs secrete exosomes, membrane-bound vesicles generated inside late endosomal multivesicular bodies (MVBs). After mating, exosomes fuse with sperm (as also seen in vitro for human prostate-derived exosomes and sperm) and interact with female reproductive tract epithelia. Exosome release was required to inhibit female remating behavior, suggesting that exosomes are downstream effectors of BMP signaling. Indeed, when BMP signaling was reduced in SCs, vesicles were still formed in MVBs but not secreted as exosomes. These results demonstrate a new function for the MVB-exosome pathway in the reproductive tract that appears to be conserved across evolution.


Figures

Figure 1.
Figure 1.
SCs secrete CD63-GFP–positive, exosome-like puncta. (A–D) Paired accessory glands (AG) expressing CD63-GFP in SCs connect to the ejaculatory duct (ED; A). Images of different magnifications show surface sections of SCs within the AG epithelium (B; from square in A, arrows mark two SCs), a transverse section through the lumen (C; bracketed region in B, arrows mark two SCs), and CD63-GFP–positive puncta in the lumen (D; square in C; an image at higher confocal gain setting is shown in Fig. S1 F). (E and F) High magnification images of surface (E) and transverse (F; asterisk marks the lumen containing GFP puncta) sections through the SC show that CD63-GFP is also found at the apical plasma membrane (arrowhead; F) and the limiting membrane of SC vacuoles, the majority of which have a dense ANCE-positive core (highlighted with arrows). One or two CD63-GFP–lined compartments per SC lack an ANCE-stained core but contain fluorescent puncta (E, asterisk). Fasciclin3 (Fas3) marks septate junctions at the cell surface, and DAPI marks nuclei (note that SCs and MCs are binucleate). (G and H) Vital staining of SCs with LysoTracker red reveals CD63-GFP–positive puncta (putative ILVs; arrows) in large acidic compartments (mMVBLs), distinguishing them from other compartment classes, such as the more abundant secretory vacuoles (SVs) and immature late endosomes (iLEs). All images show SCs from 3-d-old males incubated at 28.5°C after eclosion. (I) Schematic representation of compartments within SC in H; values below indicate the mean total numbers of each compartment in 6-d-old control SCs counted from multiple sections along the apical–basal axis; the numbers of SCs analyzed are given in brackets. Approximate outline of the SC is marked in E–H. Bars: (A and B) 200 nm; (C) 20 µm; (D–H) 5 µm.
Figure 2.
Figure 2.
Rab GTPase signatures define different SC subcellular compartments. (A–D) SCs from 3-d-old males expressing different Rab-YFP constructs and stained with LysoTracker red. SCs have 5–10 small acidic Rab7-YFP–positive iLEs (A, arrowheads; most of these are usually located more apically than this confocal section; see Fig. 3) and 2.4 ± 0.9 (n = 11) Rab7-YFP–positive large vacuoles, 85% of which are acidic mMVBLs (A, asterisks; similar numbers [2.9 ± 0.5, n = 9] of large acidic compartments are seen in CD63-GFP–expressing SCs at this stage). Other Rab-YFP lines reveal Rab11-YFP–positive, nonacidic SVs (B, +; and D), many Rab5-YFP–positive small nonacidic compartments (C, arrowheads), and more rarely (4/16 SCs), a Rab5-YFP–positive small acidic compartment (C, arrows). In some fixed tub>Rab11-YFP SCs stained for Rab7, Rab7 colocalizes with Rab11-YFP in parts of the limiting membrane (D, arrow) of a single SV (D, #). DAPI stains nuclei (blue). Approximate outline of SC is marked in all images. Bars, 5 µm.
Figure 3.
Figure 3.
CD63-GFP traffics from secretory to endocytic compartments in SCs. (A–G) An 8-h pulse (at 28.5°C) of CD63-GFP expression was chased at 18°C for 0–60 h in virgin males, and proportions of cells with one or more LysoTracker red–positive iLEs (arrows in A, C, and E in apical sections; GFP positive in C and E) and mMVBLs (asterisks in B, D, and F in more basal views) that were CD63-GFP–positive were scored (G). Data shown are from a single representative experiment out of two repeats. The images in A–F are shown again in Fig. S3 alongside the corresponding single color channel images. Approximate outline of SC is marked in all images. **, P < 0.01; ***, P < 0.001; n > 24, pairwise comparisons, Fisher’s exact test. Bars, 5 µm.
Figure 4.
Figure 4.
Real-time imaging reveals dynamic endolysosomal trafficking events. (A and B) Time-lapse imaging of 3-d-old SC>CD63-GFP males stained with LysoTracker red. (A) An mMVBL containing ILVs (asterisks) fuses with a large nonacidic SV (arrowheads; Video 1). Approximate outline of SC is marked. (B) A CD63-GFP–marked protrusion invaginates from the mMVBL membrane (arrows; 0 s) and seems to form a CD63-GFP–positive punctum in the next frame. Later, a line of peripheral acidic microdomains is seen below (48.9 s; see also Video 2). Bars, 5 µm.
Figure 5.
Figure 5.
ESCRTs, Rab GTPases, and BMP signaling regulate the exosome biogenesis pathway. (A) The numbers of CD63-GFP–positive puncta secreted into the AG lumen were significantly reduced in SC>Hrs-RNAi, SC>ALiX-RNAi, SC>Rab11DN, SC>Rab11-RNAi, SC>Dad, SC>Rab7-DN, SC>Rab7-RNAi, SC>Rab27-RNAi1, and SC>Rab35-RNAi males compared with control (number of glands above or in the bars) but not SC>Rab27-RNAi2 and SC>Evi-RNAi males. DN, dominant negative. (B–F) SCs from 6-d-old virgin males stained with LysoTracker red. (G–I) Different intracellular compartments were subsequently counted and measured. mMVBLs (asterisks) in SCs expressing CD63-GFP and Hrs-RNAi (C) or ALiX-RNAi (D) contain very few CD63-GFP–positive ILVs (internal puncta), unlike controls (B), and are altered in size (I). Reducing levels of BMP signaling in SCs (Dad overexpression; E) results in significantly smaller mMVBLs (I), typically containing a higher density of internalized fluorescent CD63-GFP than controls. SCs expressing an activated form of the BMP receptor TkvACT (F) contain fewer mMVBLs (G), which are larger (I), and typically surrounded by multiple SVs (e.g., arrow). They also contain more iLEs (H). (G–I) Mean number of mMVBLs (G) and iLEs (H) and mean diameter of largest mMVBL (I) in SCs of different genotypes (I). Quantification in G–I is from a mean of three cells per gland, averaged over n glands (numbers in bars). (J) Western analysis of AG protein extracts from w1118 (wild type [wt]) and flies expressing SC>CD63-GFP with or without (control) different transgenes. (K) Western analysis of protein extracts from reproductive tracts dissected from females mated to males of the same genotypes. CD63-GFP/ANCE is the ratio of signals from Western blots. Full-length CD63-GFP protein is observed in males and females. Error bars indicate ±SE; *, P < 0.05; **, P < 0.01; ***, P < 0.001 relative to control. Data were analyzed using either an unpaired two-tailed Student’s t test or Mann–Whitney U test, for normally and nonnormally distributed datasets, respectively. Approximate outline of SC is marked. Bars, 5 µm.
Figure 6.
Figure 6.
SC exosomes interact with sperm in females. (A) Schematic of female reproductive tract in D showing mating plug (mp), uterus (ut), oviduct (ovi), and sperm storage organs (spermathecae [spt] and seminal receptacle [sr]) as well as the autofluorescent hindgut (HG). (B and C) w1118 female reproductive tract dissected 20 min after mating to either a control w1118 (B) or SC>CD63-GFP (C) male, imaged under identical confocal settings. Images show lumen of the female uterus (asterisks) containing sperm whose heads are visible with DAPI staining (arrowheads). (D and E) Female reproductive tracts 20 min after mating to a protamineB-RFP; SC>CD63-GFP male. (D) ProtamineB-RFP (prot-RFP), which marks sperm heads, accumulates in the anterior uterus (red arrowhead) and oviduct (red arrow). Most CD63-GFP–positive exosomes localize to the posterior uterus (green asterisk), but they can also be seen in the anterior uterus (green arrowhead) and oviduct (green arrow). The autofluorescent mating plug (closed asterisk) is shown. (E) CD63-GFP–positive exosomes colocalize with sperm heads marked by protamineB-RFP (open arrows). (F) Orthogonal view of a z stack through near-complete ring of CD63-GFP fused to ProtamineB-RFP sperm head (arrows). The confocal image below the blue line shows part of the female reproductive tract lumen. The two images above the blue line, separated by a white line, are green (top) and red/green (bottom) z stacks captured in the z plane marked in the bottom image. Note multiple pairs of parallel GFP-positive lines (arrowheads), potentially produced by sperm tail fusion. (G) These (arrowheads) and irregular extended lines of fluorescence (arrow) are also seen in G, which shows a maximum 3D projection image of a z stack from a female anterior uterus and oviduct where the epithelium is marked by actin>CD8-RFP (also shown in Video 3). (H) Female reproductive tracts were dissected and fixed at specific times after the start of mating to SC>CD63-GFP males. The frequency of exosome–sperm interaction events within the female reproductive tract was analyzed (n = 8 for each time point after the start of mating [ASM]). Only fusions to the sperm heads are included. Bars: (B and C) 50 µm; (D) 200 µm; (E and F) 5 µm; (G) 20 µm.
Figure 7.
Figure 7.
SC exosomes interact with female epithelial cells. (A) Schematic of female reproductive tract shown in B. mp, posterior mating plug (autofluorescent); ut, uterus; sr, seminal receptacle; spt, spermathecae; ovi, oviduct. (B–D) actin>CD8-RFP–expressing (B and C) or wild-type (D) females mated to SC>CD63-GFP males. (B) CD63-GFP exosomes are found in the uterus (green arrow) and oviduct (green asterisk). (C and D) These exosomes accumulate at the apical surface of female reproductive tract epithelial cells (arrows), which are either marked with CD8-RFP (C; Video 4) or unmarked (D). DAPI stains nuclei. In D, the reproductive tract is stained with an antibody against human CD63 to confirm that GFP and CD63 colocalize. Specific spermathecal cells exhibit weak autofluorescence. Bars: (B) 200 µm; (C) 20 µm; (D) 5 µm.
Figure 8.
Figure 8.
Knockdown of ALiX in SCs selectively affects female postmating receptivity to other males. (A) Proportion of premated 4-d-old males of different genotypes unable to prevent all females it subsequently mates with from remating (*, P < 0.05; **, P < 0.01, Fisher’s exact test). (B and C) Egg counts (B) and progeny counts (C) from mated females before remating experiments were performed (analyzed by unpaired two-tailed Student’s t test after a Shapiro–Wilk test to confirm normality). (D–F) Mating times (D; **, P < 0.01, Student’s t test), proportion of males that mate within the first 40 min of exposure to females (E) or remate within 40 min of the end of previous mating (F), were also analyzed (using Fisher’s exact test for E and F). Values inside bars show the number of males tested (n). Error bars indicate ±SE. Data shown are from a single representative experiment out of two repeats. DN, dominant negative.
Figure 9.
Figure 9.
ALiX and Hrs have different effects on SC growth. (A) Growth of SCs relative to MCs in 6-d-old males expressing different transgenes in SCs, as measured by the ratio of SC to MC nuclear size and normalized to controls. Values inside bars show number of males tested (n). DN, dominant negative. (B–D) SCs in 6-d-old males expressing either GFP linked to a nuclear localization sequence (GFPNLS) alone (B) or in combination with either Hrs-RNAi (C) or ALiX-RNAi (D), under the control of the esgF/Ots driver. Control SC nuclei are smaller than MC nuclei at eclosion but grow to be larger by 6 d (B). Data for A were analyzed using the Student’s t test or Mann–Whitney U test (*, P < 0.05; **, P < 0.01; ***, P < 0.001, n = 10) after a Shapiro–Wilk test for normality. Error bars indicate ±SE. Bars, 10 µm.

References

    1. Aalberts, M., Sostaric E., Wubbolts R., Wauben M.W.M., Nolte-’t Hoen E.N.M., Gadella B.M., Stout T.A.E., and Stoorvogel W.. 2013. Spermatozoa recruit prostasomes in response to capacitation induction. Biochim. Biophys. Acta. 1834:2326–2335 10.1016/j.bbapap.2012.08.008 - DOI - PubMed
    1. Arienti, G., Carlini E., and Palmerini C.A.. 1997. Fusion of human sperm to prostasomes at acidic pH. J. Membr. Biol. 155:89–94 10.1007/s002329900160 - DOI - PubMed
    1. Avila, F.W., Ravi Ram K., Bloch Qazi M.C., and Wolfner M.F.. 2010. Sex peptide is required for the efficient release of stored sperm in mated Drosophila females. Genetics. 186:595–600 10.1534/genetics.110.119735 - DOI - PMC - PubMed
    1. Azmi, A.S., Bao B., and Sarkar F.H.. 2013. Exosomes in cancer development, metastasis, and drug resistance: a comprehensive review. Cancer Metastasis Rev. 32:623–642 10.1007/s10555-013-9441-9 - DOI - PMC - PubMed
    1. Baietti, M.F., Zhang Z., Mortier E., Melchior A., Degeest G., Geeraerts A., Ivarsson Y., Depoortere F., Coomans C., Vermeiren E., et al. . 2012. Syndecan-syntenin-ALIX regulates the biogenesis of exosomes. Nat. Cell Biol. 14:677–685 10.1038/ncb2502 - DOI - PubMed

Publication types

MeSH terms