. 2014 Sep 1;206(5):655-70.
doi: 10.1083/jcb.201401070. Epub 2014 Aug 25.

Mitophagy of damaged mitochondria occurs locally in distal neuronal axons and requires PINK1 and Parkin

Affiliations

Mitophagy of damaged mitochondria occurs locally in distal neuronal axons and requires PINK1 and Parkin

Ghazaleh Ashrafi et al. J Cell Biol. .

Abstract

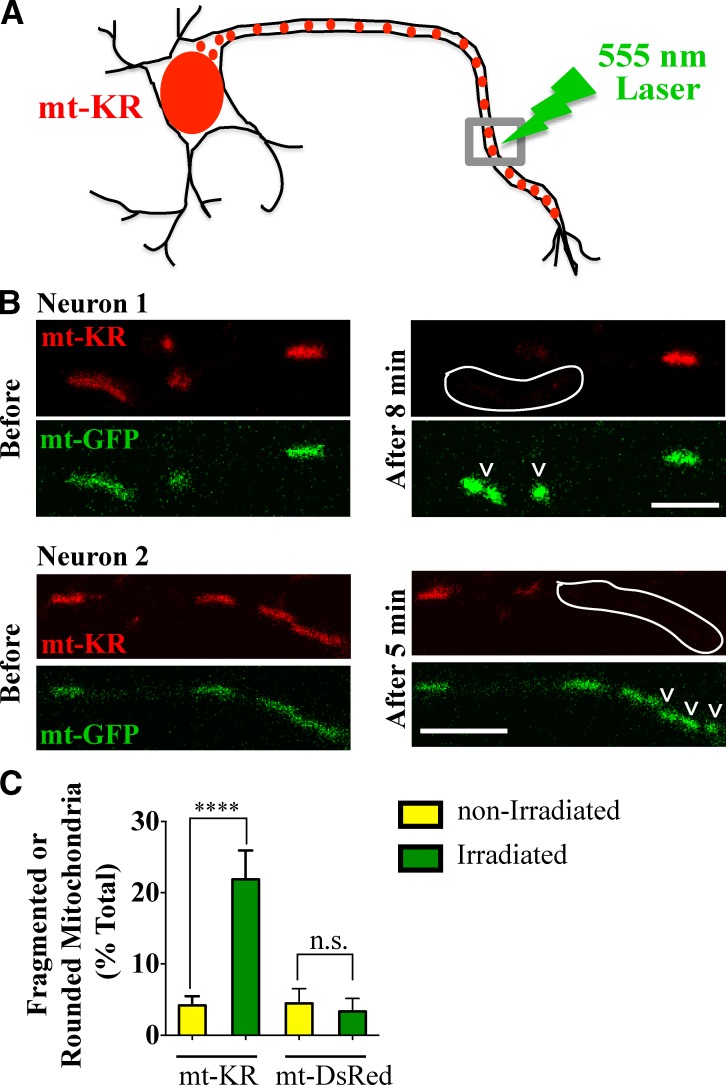
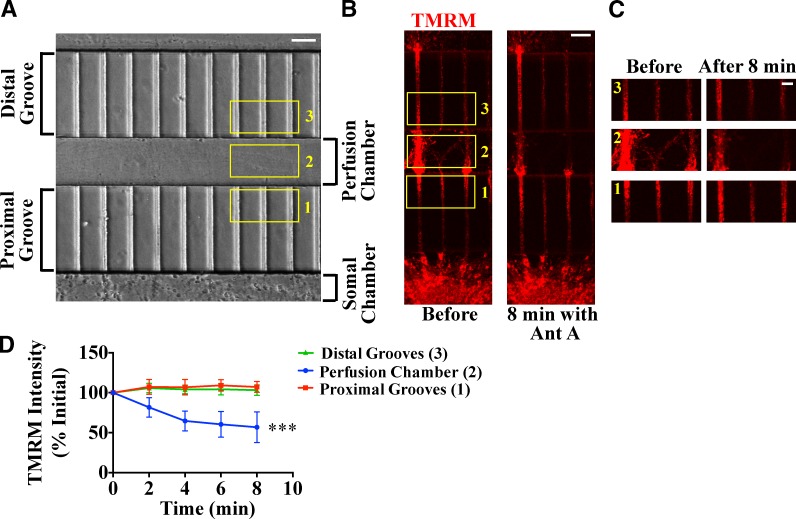
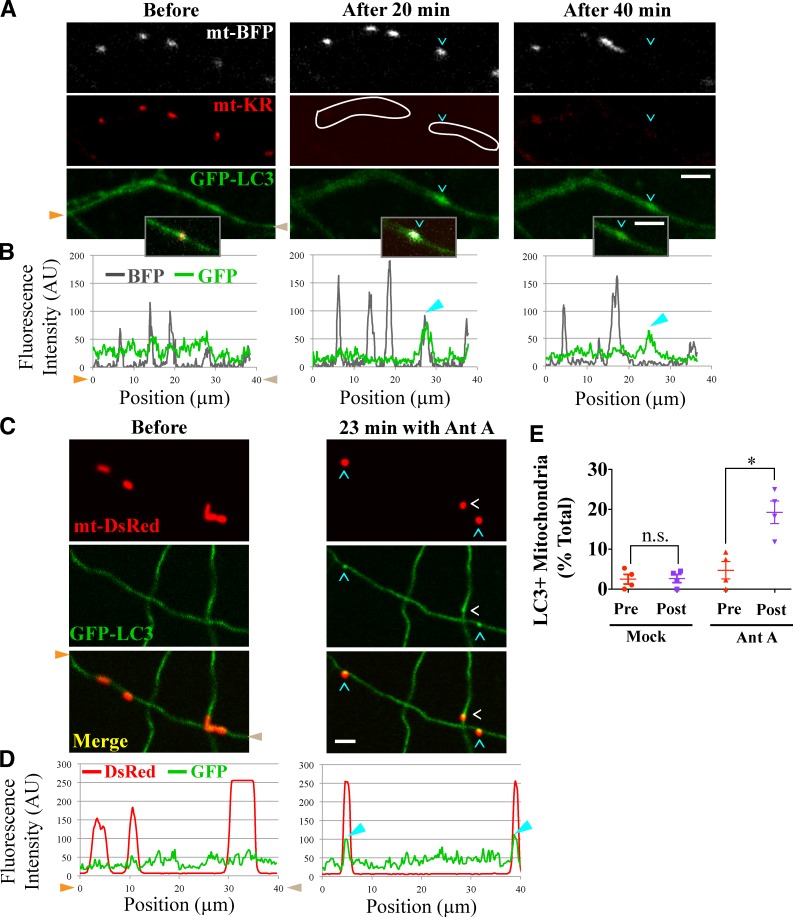
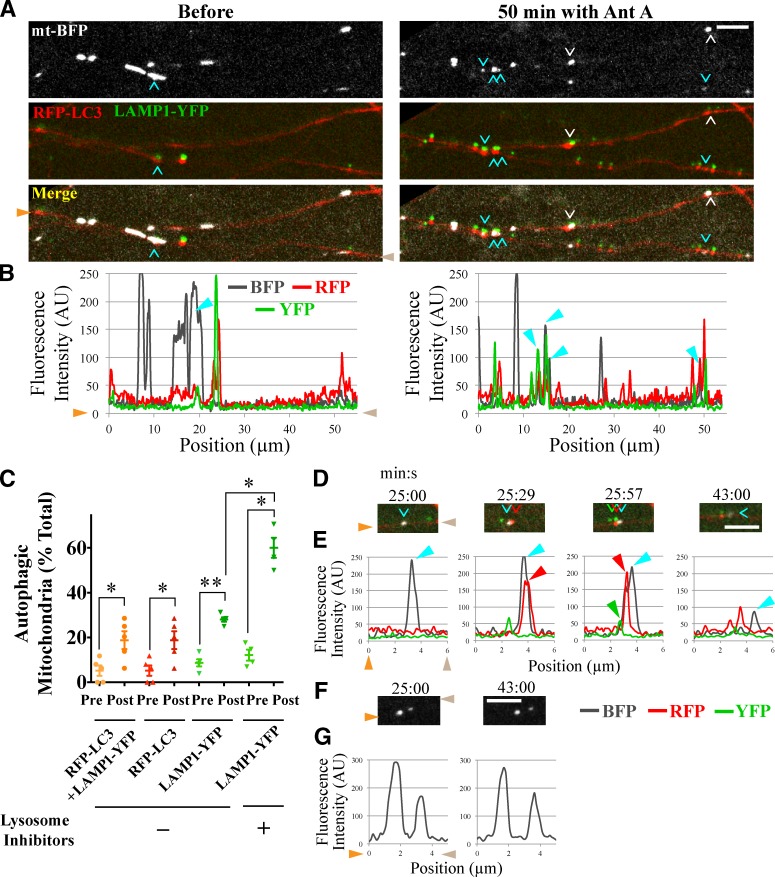
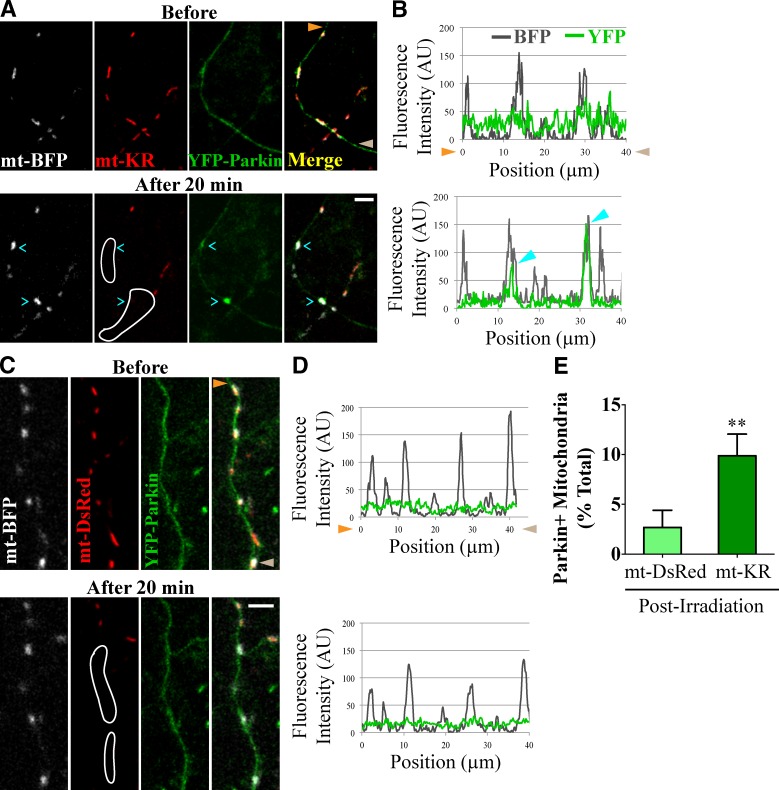
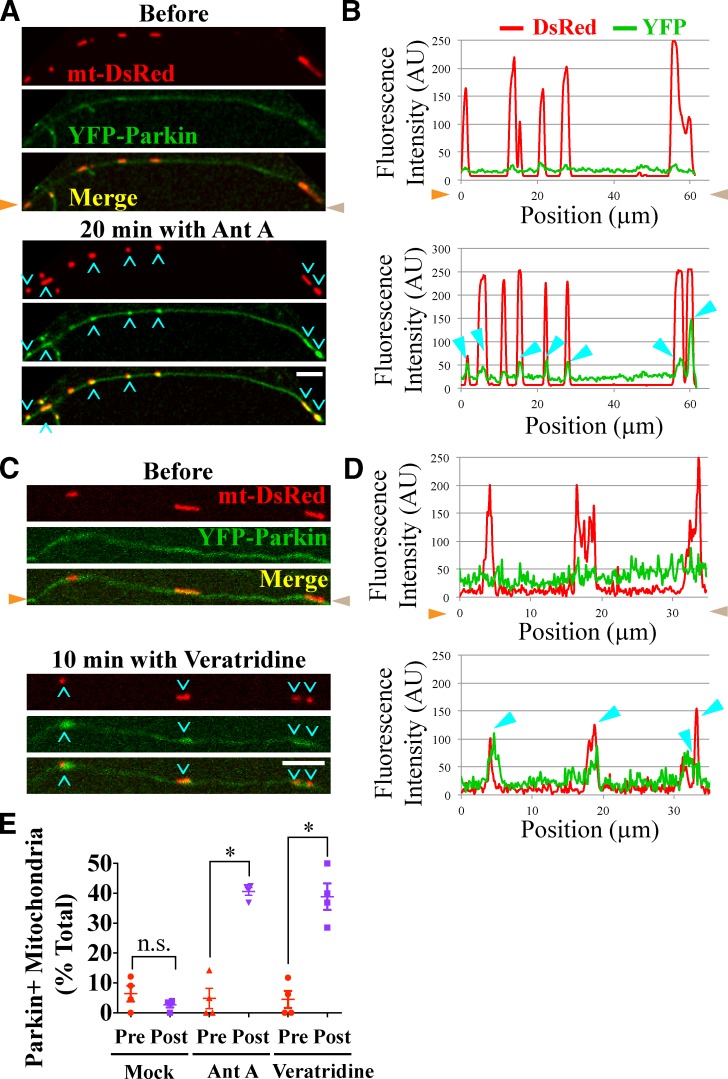
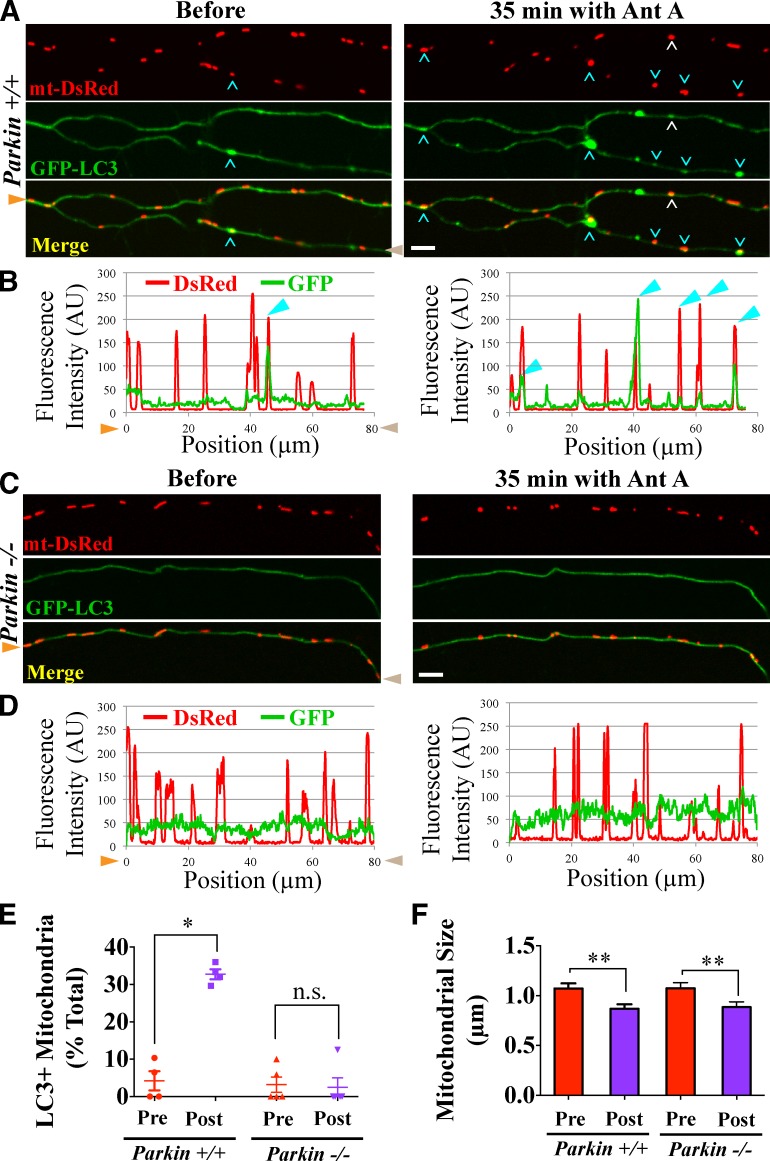
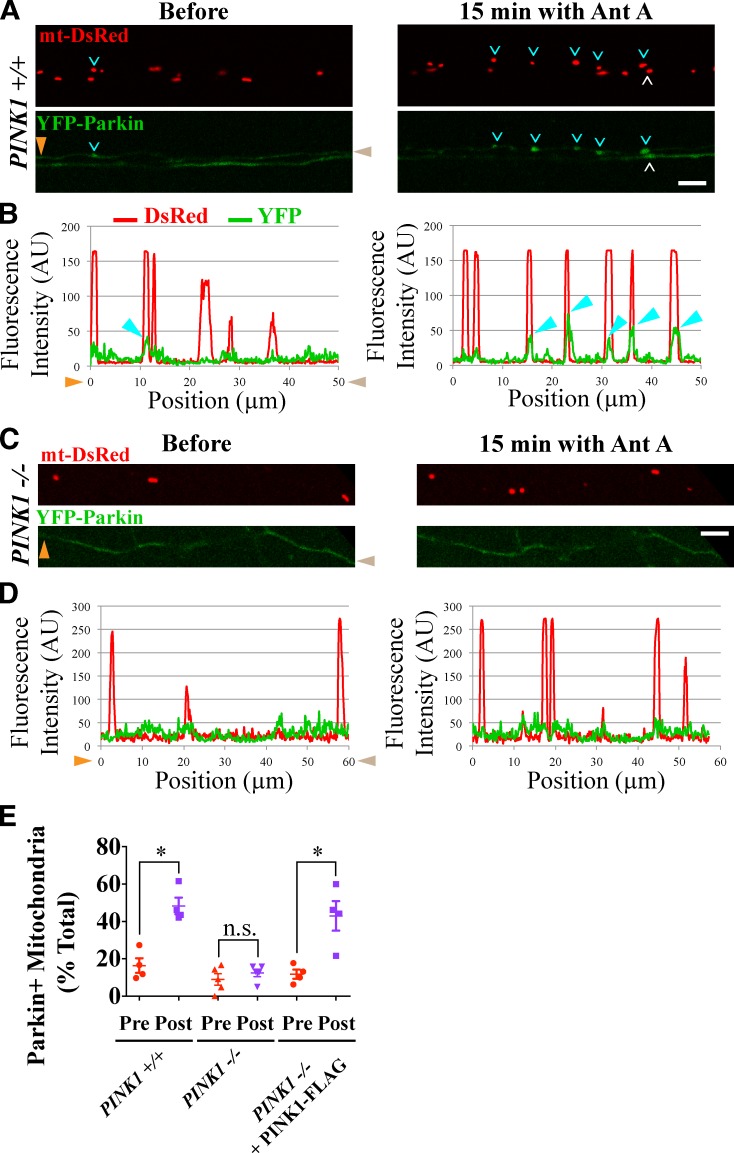
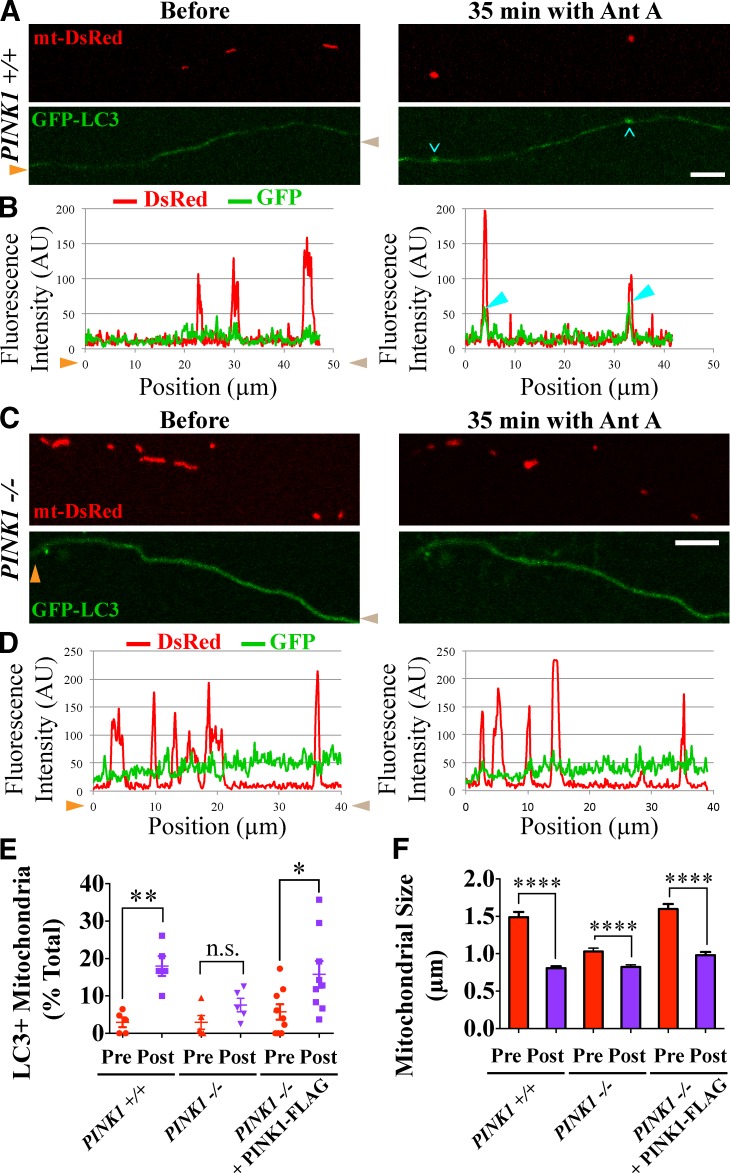
To minimize oxidative damage to the cell, malfunctioning mitochondria need to be removed by mitophagy. In neuronal axons, mitochondrial damage may occur in distal regions, far from the soma where most lysosomal degradation is thought to occur. In this paper, we report that PINK1 and Parkin, two Parkinson's disease-associated proteins, mediate local mitophagy of dysfunctional mitochondria in neuronal axons. To reduce cytotoxicity and mimic physiological levels of mitochondrial damage, we selectively damaged a subset of mitochondria in hippocampal axons. Parkin was rapidly recruited to damaged mitochondria in axons followed by formation of LC3-positive autophagosomes and LAMP1-positive lysosomes. In PINK1(-/-) axons, damaged mitochondria did not accumulate Parkin and failed to be engulfed in autophagosomes. Similarly, initiation of mitophagy was blocked in Parkin(-/-) axons. Our findings demonstrate that the PINK1-Parkin-mediated pathway is required for local mitophagy in distal axons in response to focal damage. Local mitophagy likely provides rapid neuroprotection against oxidative stress without a requirement for retrograde transport to the soma.


Figures

Figure 1.
Figure 1.
Activation of mt-KR in neuronal axons. (A) mt-KR was expressed in hippocampal neurons and activated locally with a 555-nm laser. (B) Two axons expressing mt-KR and mt-GFP before and after irradiation and concomitant photobleaching of mt-KR in the outlined regions. Mitochondria became rounded and fragmented (arrowheads), and their GFP fluorescence intensity increased. Image acquisition settings were kept constant before and after KillerRed activation. (C) Morphological changes in mitochondria expressing mt-KR or mt-DsRed were quantified. n = 88–109 irradiated and n = 293–448 nonirradiated mitochondria from 12–15 transfections. ****, P < 0.0001. Error bars represent means ± SEM. Bars, 5 µm.
Figure 2.
Figure 2.
Localized depolarization of axonal mitochondria in microfluidic devices. (A–C) Neurons were plated in the somal chamber (A), and axons grew through two sets of 200-µm microgrooves intersected by a 100-µm-long perfusion channel (B) and enlarged areas in C. Addition of 40 µM Antimycin A (Ant A) to the perfusion channel (box 2) decreased mitochondrial TMRM staining in that chamber, whereas mitochondria in the proximal and distal microgrooves (boxes 1 and 3) remained polarized. (D) Relative TMRM intensity, normalized to t = 0, as a function of time after addition of Antimycin A. The change in TMRM intensity is statistically significant only in the perfusion chamber. ***, P < 0.001 by linear regression analysis; n = 4 microfluidic devices. Error bars represent means ± SEM. Bars: (A and B) 50 µm; (C) 20 µm.
Figure 3.
Figure 3.
Damaged axonal mitochondria colocalize with autophagosomes. (A–D) Cyan and white arrowheads denote GFP-LC3–positive autophagosomes colocalizing with mitochondria. (A) Within the outlined laser-illuminated region of activated mt-KR, one mt-BFP–labeled mitochondrion colocalized with a GFP-LC3–positive autophagosome; the BFP signal from the engulfed mitochondrion was present 20 min after illumination but disappeared by 40 min, even though the autophagosome was present. In the insets are the merged images for the engulfed mitochondrion. (B) Line scan analysis of A. (C) GFP-LC3–positive autophagosomes formed on mitochondria depolarized with 40 µM Antimycin A (Ant A) in the perfusion chamber of a microfluidic device. (D) Line scan analysis of C. Here and subsequently, orange and brown arrowheads denote corresponding points in images and line scans, and mitochondria marked with cyan arrowheads correspond to similarly marked peaks in line scans. (E) Frequency of autophagosome formation before and after Antimycin A or mock treatments. n = 182–244 mitochondria from four microfluidic devices per condition. Here and in subsequent graphs, each point represents the average percentage of positive mitochondria for a single microfluidic chamber. *, P < 0.05. Error bars represent means ± SEM. AU, arbitrary unit. Bars, 5 µm.
Figure 4.
Figure 4.
Axonal lysosomes are recruited to autophagosomes containing damaged mitochondria. (A) RFP-LC3 and LAMP1-YFP–positive autolysosomes colocalize with mitochondria depolarized with 40 µM Antimycin A (Ant A). Arrowheads (cyan in the top axon and white in the bottom axon) denote LC3- and LAMP1-positive mitochondria. (B) Line scan analysis of the upper axon in A. Peaks marked by arrowheads correspond to those with cyan arrowheads in A. (C) Frequency of mitochondrial colocalization with autophagosome and lysosome markers before and 50 min after Antimycin A addition to neurons with or without preincubation with lysosomal inhibitors Pepstatin A and E64d. n = 98–171 mitochondria from five microfluidic devices. *, P < 0.05; **, P < 0.001. (D and E) Time-lapse images starting 25 min after application of Antimycin A depict an RFP-LC3–positive autophagosome (red arrowheads) forming on a fragmented mitochondrion (cyan arrowheads). A moving LAMP1-YFP–positive lysosome (green arrowhead) stopped at the mitochondrion, and the mitochondrial signal subsequently diminished. (F and G) Neighboring mitochondria imaged in the same field as D retained their BFP signal. Orange and brown arrowheads denote corresponding points in images and line scans. Error bars represent means ± SEM. AU, arbitrary unit. Bars, 5 µm.
Figure 5.
Figure 5.
Parkin is recruited to axonal mitochondria damaged with mt-KR. (A) YFP-Parkin accumulates on a fraction of axonal mitochondria in the outlined area of mt-KR activation. (B) Line scan of the axon in A with cyan arrowheads marking two YFP-Parkin–positive mitochondria. (C and D) YFP-Parkin remained diffuse despite irradiation in the outlined area when mt-DsRed replaced mt-KR. Mitochondria with YFP-Parkin levels more than twice the background were scored as Parkin-positive here and in subsequent figures. Orange and brown arrowheads denote corresponding points in images and line scans. (E) Frequency of YFP-Parkin recruitment to irradiated mitochondria. n = 131–140 mitochondria from 12 transfections. **, P < 0.001. Error bars represent means ± SEM. AU, arbitrary unit. Bars, 5 µm.
Figure 6.
Figure 6.
Parkin recruitment by Antimycin A and Veratridine. (A–D) Exposing axonal segments to 40 µM Antimycin A (Ant A; A and B) or 250 nM Veratridine (C and D) led to recruitment of YFP-Parkin to mitochondria (cyan arrowheads). Orange and brown arrowheads denote corresponding points in images and line scans. (E) Frequency of YFP-Parkin recruitment. n = 59–98 mitochondria from four microfluidic devices per condition. *, P < 0.05. Error bars represent means ± SEM. AU, arbitrary unit. Bars, 5 µm.
Figure 7.
Figure 7.
Initiation of axonal mitophagy requires Parkin. (A and B) GFP-LC3–positive autophagosomes (white and cyan arrowheads) form on mitochondria of wild-type (Parkin+/+) axon segments treated with 20 µM Antimycin A (Ant A). Cyan arrowheads point to mitochondria in the axon analyzed in B. (C and D) In Parkin−/− axons, mitochondria did not acquire autophagosomes. Orange and brown arrowheads denote corresponding points in images and line scans. (E) Frequency of autophagosome formation axons before and after Antimycin A. n = 104–106 mitochondria from four to five microfluidic devices per genotype. (F) Quantification of mitochondrial size before and after 20 min of 20 µM Antimycin A treatment indicates that damage-induced mitochondrial remodeling is Parkin independent. The sizes of the fragmented mitochondria may be overestimates because of the limited resolution of the microscope. n = 76–99 mitochondria from four to five microfluidic devices per genotype. *, P < 0.05; **, P < 0.001. Error bars represent means ± SEM. AU, arbitrary unit. Bars, 5 µm.
Figure 8.
Figure 8.
Parkin recruitment to damaged axonal mitochondria requires PINK1. (A–D) YFP-Parkin is recruited to mitochondria of PINK1+/+ (A and B) but not PINK1−/− (C and D) rat hippocampal axons depolarized with 40 µM Antimycin A (Ant A). White and cyan arrowheads denote YFP-Parkin–positive mitochondria; cyan arrowheads point to mitochondria analyzed with line scans in B and D. Orange and brown arrowheads denote corresponding points in images and line scans. (E) Frequency of Parkin recruitment in the indicated genotypes before and 15 min after Antimycin A treatment. n = 87–101 mitochondria from four microfluidic devices per genotype. *, P < 0.05. Error bars represent means ± SEM. AU, arbitrary unit. Bars, 5 µm.
Figure 9.
Figure 9.
Mitophagy of damaged axonal mitochondria is impaired in the absence of PINK1. (A–D) GFP-LC3–positive autophagosomes form on mitochondria of PINK1+/+ (A and B) but not PINK1−/− (C and D) rat hippocampal axons depolarized for 35 min with 40 µM Antimycin A (Ant A). (B and D) Cyan arrowheads denote GFP-LC3–positive mitochondria. (E) Frequency of autophagosome formation before and after Antimycin A treatment. Orange and brown arrowheads denote corresponding points in images and line scans. (F) Quantification of mitochondrial size before and after 20 min of Antimycin A treatment indicates that mitochondrial remodeling upon damage is PINK1 independent. Untreated mitochondria in PINK1−/− axons are smaller than those in PINK1+/+ or PINK1-FLAG–expressing PINK1−/− axons. n = 108–342 mitochondria from five to nine microfluidic devices per genotype. *, P < 0.05; **, P < 0.001; ****, P < 0.0001. Error bars represent means ± SEM. AU, arbitrary unit. Bars, 5 µm.

Comment in

References

    1. Almeida, A., Almeida J., Bolaños J.P., and Moncada S.. 2001. Different responses of astrocytes and neurons to nitric oxide: the role of glycolytically generated ATP in astrocyte protection. Proc. Natl. Acad. Sci. USA. 98:15294–15299 10.1073/pnas.261560998 - DOI - PMC - PubMed
    1. Almeida, A., Moncada S., and Bolaños J.P.. 2004. Nitric oxide switches on glycolysis through the AMP protein kinase and 6-phosphofructo-2-kinase pathway. Nat. Cell Biol. 6:45–51 10.1038/ncb1080 - DOI - PubMed
    1. Ambrosi, G., Cerri S., and Blandini F.. 2014. A further update on the role of excitotoxicity in the pathogenesis of Parkinson’s disease. J. Neural Transm. 10.1007/s00702-013-1149-z - DOI - PubMed
    1. Bains, M., and Heidenreich K.A.. 2009. Live-cell imaging of autophagy induction and autophagosome-lysosome fusion in primary cultured neurons. Methods Enzymol. 453:145–158 10.1016/S0076-6879(08)04007-X - DOI - PMC - PubMed
    1. Berger, A.K., Cortese G.P., Amodeo K.D., Weihofen A., Letai A., and LaVoie M.J.. 2009. Parkin selectively alters the intrinsic threshold for mitochondrial cytochrome c release. Hum. Mol. Genet. 18:4317–4328 10.1093/hmg/ddp384 - DOI - PMC - PubMed

Publication types

MeSH terms