. 2014 Sep 8;26(3):319-330.
doi: 10.1016/j.ccr.2014.07.014. Epub 2014 Aug 21.

The somatic genomic landscape of chromophobe renal cell carcinoma

Collaborators, Affiliations

The somatic genomic landscape of chromophobe renal cell carcinoma

Caleb F Davis et al. Cancer Cell. .

Abstract

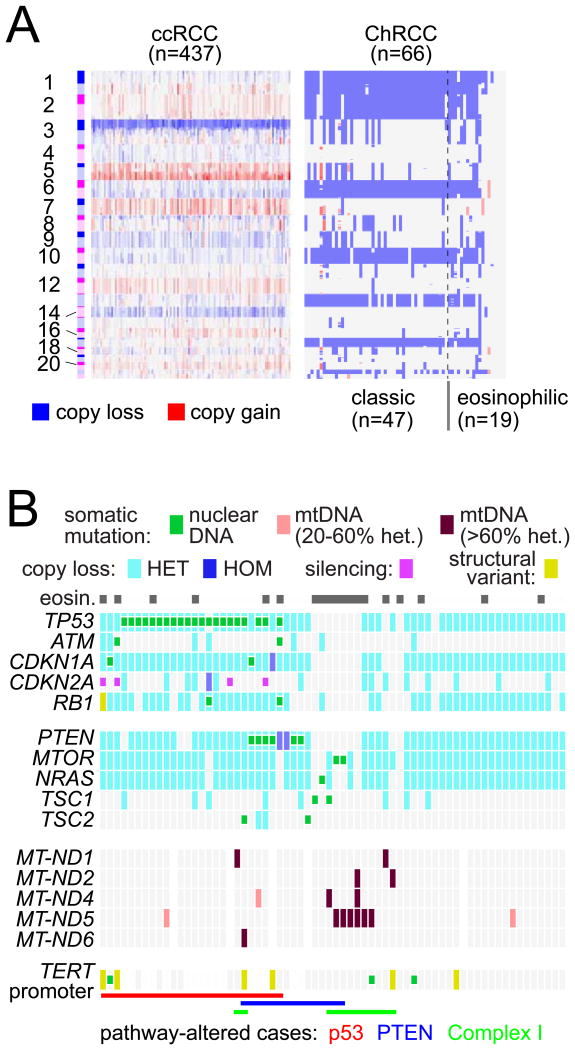
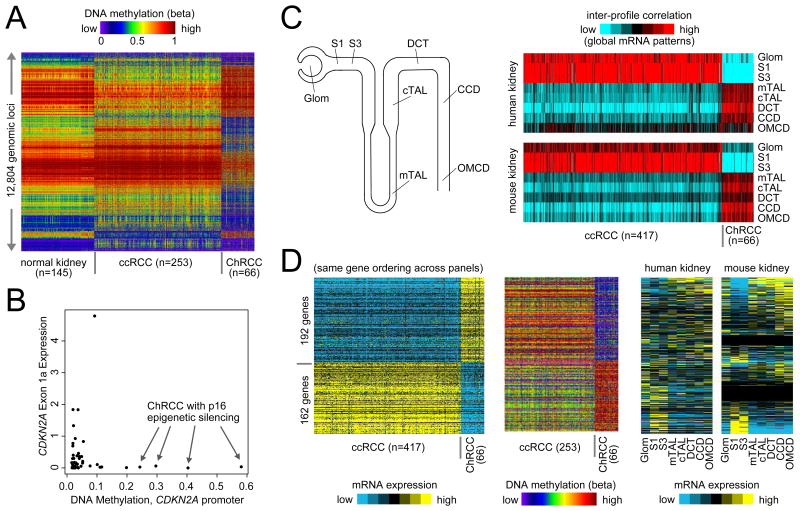
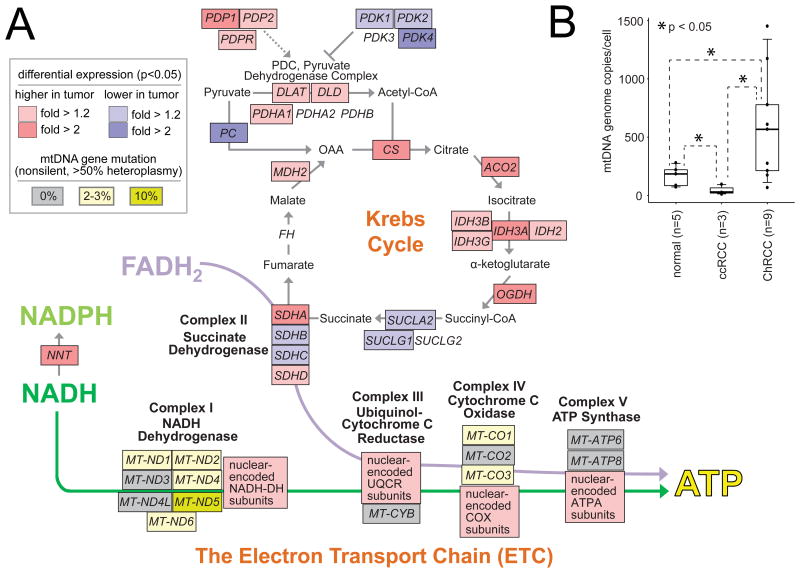
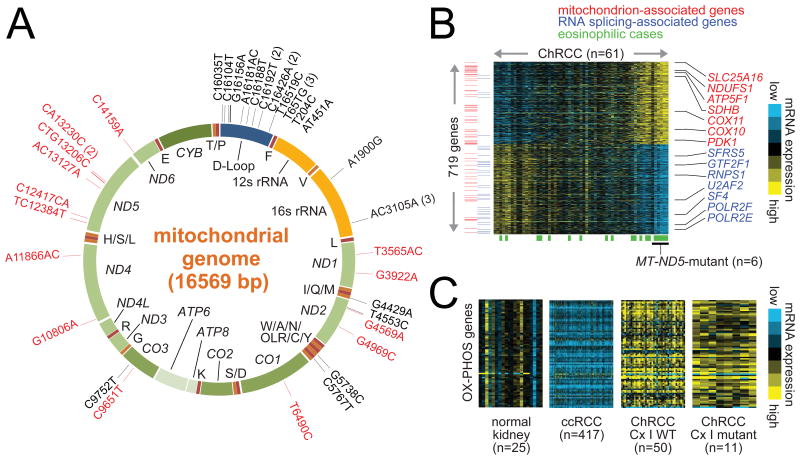
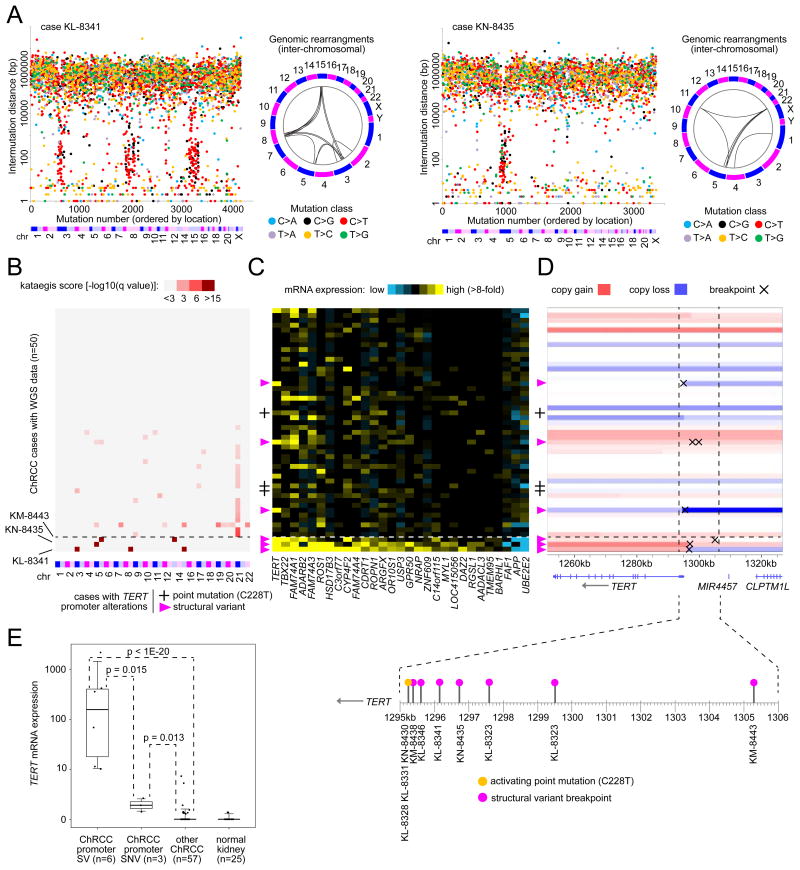
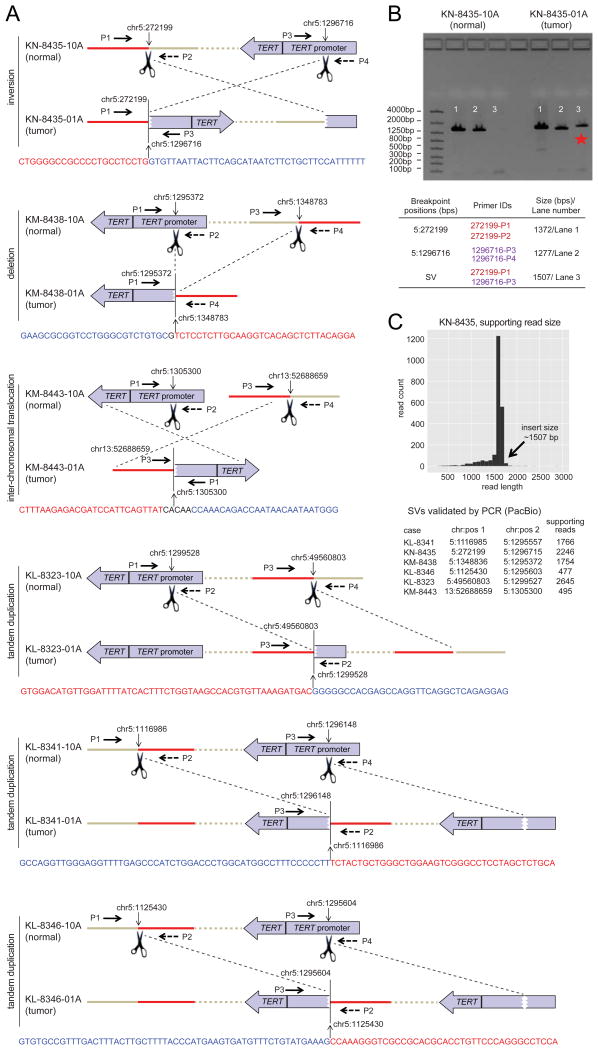
We describe the landscape of somatic genomic alterations of 66 chromophobe renal cell carcinomas (ChRCCs) on the basis of multidimensional and comprehensive characterization, including mtDNA and whole-genome sequencing. The result is consistent that ChRCC originates from the distal nephron compared with other kidney cancers with more proximal origins. Combined mtDNA and gene expression analysis implicates changes in mitochondrial function as a component of the disease biology, while suggesting alternative roles for mtDNA mutations in cancers relying on oxidative phosphorylation. Genomic rearrangements lead to recurrent structural breakpoints within TERT promoter region, which correlates with highly elevated TERT expression and manifestation of kataegis, representing a mechanism of TERT upregulation in cancer distinct from previously observed amplifications and point mutations.


Figures

Figure 1
Figure 1. Gene mutations and copy alterations in Chromophobe Renal Cell Carcinoma (ChRCC)
(A) Copy number alterations (red, gain; blue, loss of one copy) by cytoband region (marker: darker color, p arm; lighter color, q arm) in ChRCC and ccRCC. (B) Genomic alterations in ChRCC samples, each column representing a sample. See also Figure S1 and Table S2.
Figure 2
Figure 2. DNA methylation and gene expression differences between ChRCC and ccRCC
(A) Heatmap showing a randomly selected 20% of a total of 64,021 DNA methylation loci in normal kidney, ChRCC, and ccRCC (red, high; blue, low). (B) Epigenetic silencing of CDKN2A locus in four ChRCC cases. Exon 1a expression corresponds to p16INK4a isoform. (C) A cartoon of nephron (left) and heatmaps showing inter-sample correlations (red, positive) between profiles of kidney tumors (columns; TCGA data, arranged by subtype) and profiles of kidney nephon sites (rows; data set from Cheval et al., 2012). Glom, Kidney Glomerulus; S1/S2, Kidney Proximal Tubule; MTAL, Kidney Medullary Thick Ascending Limb of Henle's Loop; CTAL, Kidney cortical Thick Ascending Limb of Henle's Loop; DCT, Kidney Distal Convoluted Tubule; CNT, Kidney Connecting Tubule; CCD, Kidney Cortical Collecting Duct; OMCD, Kidney Outer Medullary Collecting Duct. (D) Genes showing coordinate methylation and expression changes between ChRCC and ccRCC, with the corresponding patterns in the nephron by anatomical site. See also Figure S2 and Tables S3-S5.
Figure 3
Figure 3. Molecular alterations in ChRCC involve mitochondria
(A) Mutations and gene expression differences between ChRCC and normal kidney in the context of the mitochondrion. Red and blue shading represents increased and decreased expression of nuclear-encoded genes, respectively, in ChRCC; two-sided t-test and fold change by unpaired analysis. Mutation rates are also indicated for mitochondrial DNA (mtDNA) encoded genes (not evaluated for expression): gray, no mutation; yellow, mutations detected. (B) mtDNA copy number analysis. p value by two-sided t-test with unequal variance. Box plots represent 5%, 25%, median, 75%, and 95%. See also Figure S3.
Figure 4
Figure 4. Integrative analysis of mtDNA mutations in ChRCC
(A) mtDNA somatic mutations (with >50% heteroplasmy) in 61 ChRCC, by LR-PCR method. Red, variants that result in amino acid change. (B) Gene expression difference (719 genes with p<0.001 by t-test, FDR<0.05) between ChRCC cases harboring MT-ND5 mutations in most mtDNA copies (>70% heteroplasmy) versus other ChRCC. (C) Expression of nuclear-encoded subunits of Complexes I-V, or “OX-PHOS,” in ChRCC and ccRCC, with (>50% heteroplasmy) or without harboring complex I (Cx I) mutations, relative to normal kidney. See also Figure S4 and Table S6.
Figure 5
Figure 5. Kataegis and TERT in ChRCC
(A) Examples of a strong kataegis pattern in two ChRCC cases. ‘Rainfall’ plots of mutations by Whole Genome Sequencing (WGS) order events by genomic location. Vertical axis denotes genomic distance of each mutation from the previous mutation. (B) WGS profiles for 50 ChRCC cases, each scored by genomic region (chromosome pter/qter) for kataegis. The three ChRCC cases scoring particularly strong are indicated at the bottom. Score for a given region represents a one-sided Fisher's exact test, for enrichment of C>T or C>G mutations involving inter-mutation distances below 10 kb (corrected for testing of multiple regions). (C) A set of 29 differentially expressed genes (False Discovery Rate, or FDR<0.05), including TERT, observed in ChRCC cases with strong kataegis versus other ChRCC. (D) Copy variation and DNA breakpoint analysis identifying genomic rearrangements involving the promoter region of TERT for the 50 ChRCC cases (case ordering the same for panels B, C, and D). The six cases harboring rearrangements involving TERT are indicated (pink triangles). (E) TERT expression levels in the ChRCC cases with TERT promoter Structural Variant (SV), in the ChRCC cases with TERT promoter mutation (SNV), and in the remaining cases, as well as in normal kidney samples. p values by two-sided t-test on log-transformed data. Box plots represent 5%, 25%, median, 75%, and 95%. See also Figure S5 and Table S7.
Figure 6
Figure 6. Genomic structural variants (SVs) involving TERT promoter
(A) Schematic represenation of the PCR approach used to validate TERT promoter SVs in the six ChRCC cases and the DNA sequence sorrounding the breaking point in each case. For each SV, PCR primers (P1/P2/P3/P4) were designed to span both sides of the breakpoint junction, as illustrated. (B) For case KN-8435 (as an example), DNA spanning the SV breakpoint region could be amplified in the tumor sample (but not in the paired normal sample). (C) For each of the six cases, amplified DNA representing SV was confirmed by sequencing (PacBio platform, which features long reads), with sufficient reads and expected length of the PCR product being observed (top, for KN-8435), and with estimated breakpoint positions being close to those of WGS results (bottom). See also Figure S6 and Table S8.

References

    1. Alexandrov LB, Nik-Zainal S, Wedge DC, Aparicio SA, Behjati S, Biankin AV, Bignell GR, Bolli N, Borg A, Borresen-Dale AL, et al. Signatures of mutational processes in human cancer. Nature. 2013;500:415–421. - PMC - PubMed
    1. Amin MB, Amin MB, Tamboli P, Javidan J, Stricker H, de-Peralta Venturina M, Deshpande A, Menon M. Prognostic impact of histologic subtyping of adult renal epithelial neoplasms: an experience of 405 cases. Am J Surg Pathol. 2002;26:281–291. - PubMed
    1. Amin MB, Paner GP, Alvarado-Cabrero I, Young AN, Stricker HJ, Lyles RH, Moch H. Chromophobe renal cell carcinoma: histomorphologic characteristics and evaluation of conventional pathologic prognostic parameters in 145 cases. Am J Surg Pathol. 2008;32:1822–1834. - PubMed
    1. Brunelli M, Eble JN, Zhang S, Martignoni G, Delahunt B, Cheng L. Eosinophilic and classic chromophobe renal cell carcinomas have similar frequent losses of multiple chromosomes from among chromosomes 1, 2, 6, 10, and 17, and this pattern of genetic abnormality is not present in renal oncocytoma. Modern pathology : an official journal of the United States and Canadian Academy of Pathology, Inc. 2005;18:161–169. - PubMed
    1. Cancer_Genome_Atlas_Research_Network. Weinstein J, Collisson E, Mills G, Shaw K, Ozenberger B, Ellrott K, Shmulevich I, Sander C, Stuart J. The Cancer Genome Atlas Pan-Cancer analysis project. Nature genetics. 2013;45:1113–1120. - PMC - PubMed

Publication types