

Trends in central nervous system tumor incidence relative to other common cancers in adults, adolescents, and children in the United States, 2000 to 2010
- PMID: 25155924
- PMCID: PMC4298242
- DOI: 10.1002/cncr.29015
Trends in central nervous system tumor incidence relative to other common cancers in adults, adolescents, and children in the United States, 2000 to 2010
Abstract
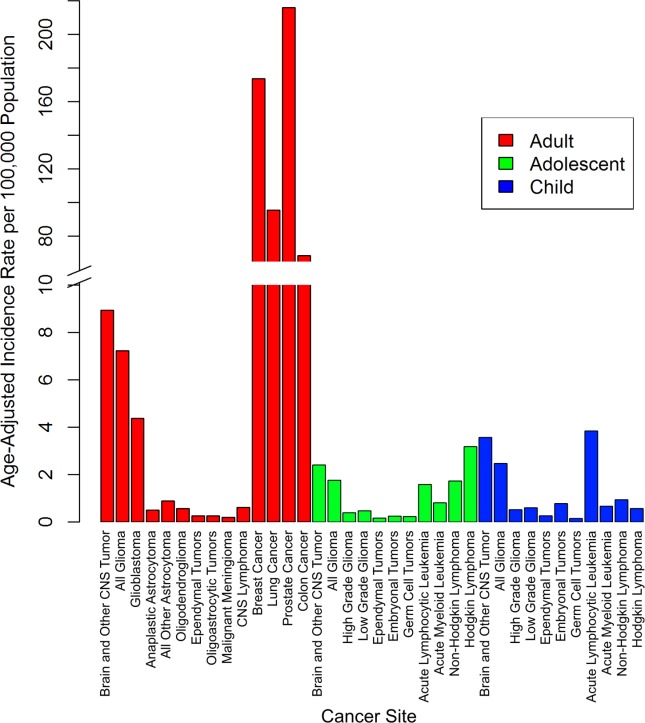
Background: Time trends in cancer incidence rates (IR) are important to measure the changing burden of cancer on a population over time. The overall IR of cancer in the United States is declining. Although central nervous system tumors (CNST) are rare, they contribute disproportionately to mortality and morbidity. In this analysis, the authors examined trends in the incidence of the most common cancers and CNST between 2000 and 2010.
Methods: The current analysis used data from the United States Cancer Statistics publication and the Central Brain Tumor Registry of the United States. Age-adjusted IR per 100,000 population with 95% confidence intervals and the annual percent change (APC) with 95% confidence intervals were calculated for selected common cancers and CNST overall and by age, sex, race/ethnicity, selected histologies, and malignancy status.
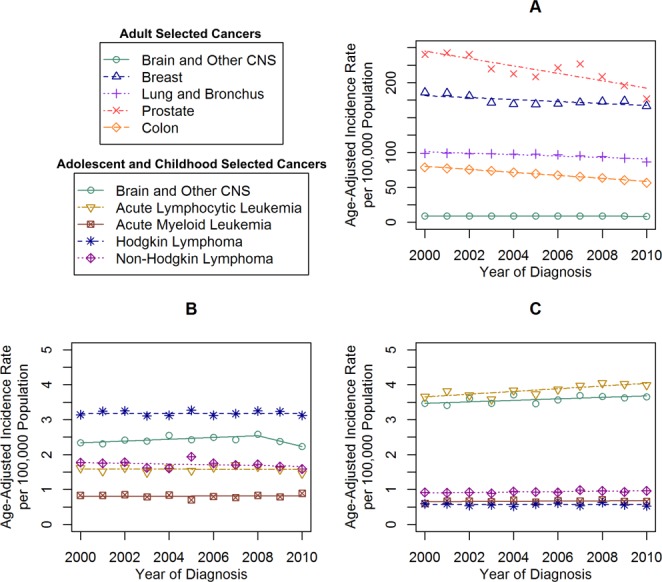
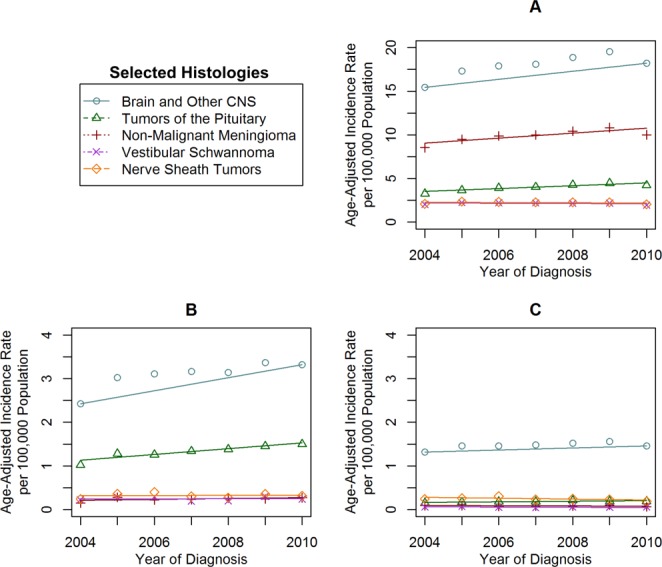
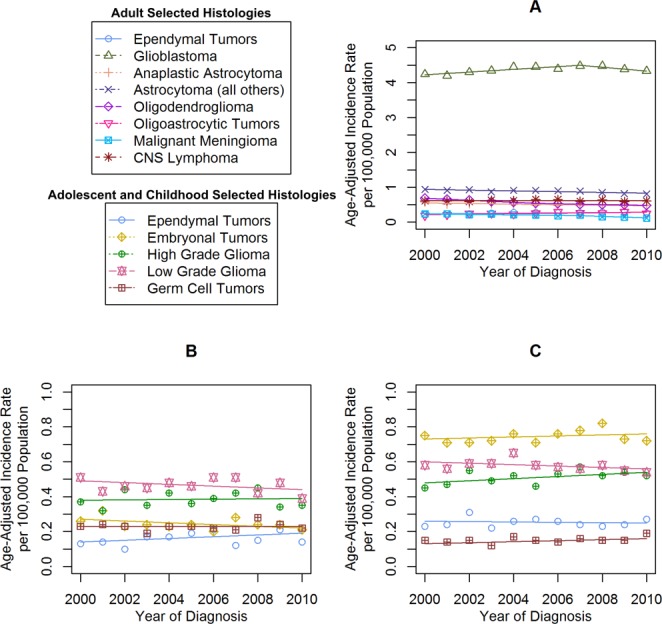
Results: In adults, there were significant decreases in colon (2000-2010: APC, -3.1), breast (2000-2010: APC, -0.8), lung (2000-2010: APC, -1.1), and prostate (2000-2010: APC, -2.4) cancer as well as malignant CNST (2008-2010: APC, -3.1), but a significant increase was noted in nonmalignant CNST (2004-2010: APC, 2.7). In adolescents, there were significant increases in malignant CNST (2000-2008: APC, 1.0) and nonmalignant CNST (2004-2010: APC, 3.9). In children, there were significant increases in acute lymphocytic leukemia (2000-2010: APC, 1.0), non-Hodgkin lymphoma (2000-2010: APC, 0.6), and malignant CNST (2000-2010: APC, 0.6).
Conclusions: Surveillance of IR trends is an important way to measure the changing public health and economic burden of cancer. In the current study, there were significant decreases noted in the incidence of adult cancer, whereas adolescent and childhood cancer IR were either stable or increasing.
Keywords: Central Brain Tumor Registry of the United States (CBTRUS); United States Cancer Statistics (USCS); annual percent change (APC); central nervous system tumors; incidence rates; time trends.
© 2014 The Authors. Cancer published by Wiley Periodicals, Inc. on behalf of American Cancer Society.
Figures
References
-
- Siegel R, Ma J, Zou Z, Jemal A. Cancer statistics, 2014. CA Cancer J Clin. 2014;64:9–29. - PubMed
-
- Ward E, Esantis C, Robbins A, Kohler B, Jemal A. Childhood and adolescent cancer statistics, 2014. CA Cancer J Clin. 2014;64:83–103. - PubMed
-
- Howlader N, Noone AM, Krapcho M. SEER Cancer Statistics Review, 1975-2010. Bethesda, MD: National Cancer Institute; 2013.
-
- McCarthy BJ, Kruchko C, Dolecek TA. The impact of the Benign Brain Tumor Cancer Registries Amendment Act (Public Law 107-260) on non-malignant brain and central nervous system tumor incidence trends. J Registry Manag. 2013;40:32–35. - PubMed
Publication types
MeSH terms
Grants and funding
LinkOut - more resources
Full Text Sources
Other Literature Sources
