. 2015 Feb;63(2):579-85.
doi: 10.1016/j.molimm.2014.08.002. Epub 2014 Aug 23.

Histone deacetylase 11: A novel epigenetic regulator of myeloid derived suppressor cell expansion and function

Affiliations

Histone deacetylase 11: A novel epigenetic regulator of myeloid derived suppressor cell expansion and function

Eva Sahakian et al. Mol Immunol. 2015 Feb.

Abstract

Myeloid-derived suppressor cells (MDSCs), a heterogeneous population of cells capable of suppressing anti-tumor T cell function in the tumor microenvironment, represent an imposing obstacle in the development of cancer immunotherapeutics. Thus, identifying elements essential to the development and perpetuation of these cells will undoubtedly improve our ability to circumvent their suppressive impact. HDAC11 has emerged as a key regulator of IL-10 gene expression in myeloid cells, suggesting that this may represent an important targetable axis through which to dampen MDSC formation. Using a murine transgenic reporter model system where eGFP expression is controlled by the HDAC11 promoter (Tg-HDAC11-eGFP), we provide evidence that HDAC11 appears to function as a negative regulator of MDSC expansion/function in vivo. MDSCs isolated from EL4 tumor-bearing Tg-HDAC11-eGFP display high expression of eGFP, indicative of HDAC11 transcriptional activation at steady state. In striking contrast, immature myeloid cells in tumor-bearing mice display a diminished eGFP expression, implying that the transition of IMC to MDSC's require a decrease in the expression of HDAC11, where we postulate that it acts as a gate-keeper of myeloid differentiation. Indeed, tumor-bearing HDAC11-knockout mice (HDAC11-KO) demonstrate a more suppressive MDSC population as compared to wild-type (WT) tumor-bearing control. Notably, the HDAC11-KO tumor-bearing mice exhibit enhanced tumor growth kinetics when compare to the WT control mice. Thus, through a better understanding of this previously unknown role of HDAC11 in MDSC expansion and function, rational development of targeted epigenetic modifiers may allow us to thwart a powerful barrier to efficacious immunotherapies.

Keywords: HDAC11; Immuno-suppression; MDSCs; Myelopoiesis.


Figures

Figure 1
Figure 1. The expression of HDAC11 in different compartments of IMCs at steady state (without tumor challenge)
Bone marrow aspirate (A & B), splenocytes (C), and PBMCs (D) were isolated from two naive Tg-HDAC11-eGFP mice. Using flow cytometric analysis, first expression of HDAC11 transcript (by examining the expression of eGFP protein) in the neutrophils, monocytes, and DCs (A) were assessed. Next, expression of eGFP in CD11b+/GR-1+ as well as CD11b+Ly6G/Ly6Chigh and CD11b+/Ly6G+/Ly6Clow compartments of IMCs were determined. The percentages depicted in these histograms are indicative of HDAC11 promoter-driven eGFP reporter gene expression. q-RT-PCR analysis further demonstrates that in this transgenic model, eGFP expression is consistent with HDAC11 mRNA expression. Data presented here is a representative of three individual experiments.
Figure 2
Figure 2. The expression of HDAC11 message in tumor challenged TgHDAC11-eGFP mice
(A) (Top panel) Flow cytometric data analysis demonstrating the destitution of CD11b+/GR-1+ cells in a naïve TgHDAC11-eGFP mice (Top-Left) and the expansion of MDSCs in EL4 tumor challenged TgHDAC11-eGFP mice (Day 25 after inoculation of tumors sub cutaneous 2.5 × 10⁵ cells/injection). The expansions of these cells were compared to the IMCs percentage in naïve mice. Concurrently, polychromatic representation of data was utilized to highlight the changes in expression of HDAC11 transcript. (Black dots represent HDAC11- while green dots show HDAC11+ cells) (Top-right). (B) A graphic demonstration of eGFP negative percent of CD11b+/GR-1+ cell population in naïve splenocytes compared to EL4 tumor challenged (Day 25) mouse splenocytes as well as tumor cells. (C) q-RT-PCR data analysis for eGFP message expression in CD11b+/GR-1+ cell population isolated from naïve and EL4 tumor challenged Tg-HDAC11-eGFP mice. (D) q-RT-PCR data analysis for HDAC11 message expression in CD11b+/GR-1+ cell population isolated from naïve and EL4 tumor challenged Tg-HDAC11-eGFP mice. The flow data represented in this figure was analyzed by collecting 50,000 events and is a representative figure out of three individual experiments.
Figure 3
Figure 3. Suppressive capacity of GR-1+ eGFP negative MDSCs vs GR-1+ eGFP positive MDSCs
(A) eGFP+ and or eGFP- tumor MDSCs were sorted (FACSAria Sorting BD) by either GR-1+/eGFP (HDAC11-) and or GR-1+/eGFP+ (HDAC11+) populations from three EL4 tumor challenged mice (24 days). Functional assay analysis in this experiment was performed using the OT-I transgenic mouse/OVA-peptide CD8 T cells stimulation model. Functionality of T cells from OT-I mice in the presence -or absence of cognate peptide (OVA peptide257-264 for CD8+ T-cells) were measured by their capacity to produce IFN-γ upon peptide stimulation and in the presence or absence of MDSCs. Probability values of p ≤ 0.05 were considered significant in eGFP negative MDSCs vs eGFP Positive MDSCs. The bar graph is a representative functional assay ELISA analysis for IFN-γ production from three independent experiments.
Figure 4
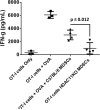
Figure 4. Suppressive capacity of isolated MDSCs from tumor challenged C57BL/6 WT vs HDAC11-KO mice
(A) HDAC11-KO mice and their control counter parts C57BL/6 WT mice were inoculated with EL4 tumors (sub cutaneous 2.5 × 10⁵ cells/injection for 24 day as previously described. Splenocytes for each animal group (3 mice/group) were harvested, isolated and sorted (FACSAria Sorting BD) for CD11b+/GR-1+. Functional assay analysis in this experiment was performed using the OT-I transgenic mouse/OVA-peptide CD8 T cell stimulation model. Functionality of T cells from OT-I mice in the presence -or absence of cognate peptide (OVA peptide257-264 for CD8+ T-cells) were measured by their capacity to produce IFN-γ upon peptide stimulation and in the presence or absence of MDSCs. Probability values of p ≤ 0.05 were considered significant in C57BL/6 WT MDSCs vs HDAC11-KO MDSCs. The bar graph is a representative functional assay ELISA analysis for IFN-γ production from three independent experiments.
Figure 5
Figure 5. Expression of suppressive cytokine IL-10 is increased in HDAC11 null Gr-1+ population at steady state as well as under tumor burden
(A) HDAC11-KO and their control counter parts C57BL/6 WT mice (no tumor inoculation—steady-state) were euthanized and splenocytes for each animal group (3 mice/group) were harvested, isolated and sorted (FACSAria Sorting BD) for CD11b+/GR-1+. These cells were next treated with or without LPS (1ug/mL) for 6hrs. IL-10 expression was assessed using qRT-PCR analysis. (B) eGFP+ and or eGFP- tumor MDSCs (CD11b+/GR-1+) were sorted by either GR-1+/eGFP- (HDAC11-) and or GR-1+/eGFP+ (HDAC11+) populations from three EL4 tumor challenged mice (24 days). Probability values of p ≤ 0.05 were considered significant in comparing populations within groups. The bar graph illustrations for the expression IL-10 is a representative figure from two independent experiments.
Figure 6
Figure 6. HDAC11 deficient mice demonstrate a more enhanced tumor growth when compared to C57BL/6 wild-type counterparts
HDAC11-KO and their control counterparts C57BL/6 WT mice (3 mice per group) were inoculated with sub cutaneous injection of EL4 cells at 2.5 × 10⁵ cells/injection for 21 days (A) or Panco cells at 5 × 10⁴ for 23 days (B). Tumors were measured at 3 day intervals once palpable. Graphs presented here are linear representation of tumor growth in each tumor model. Probability values of p ≤ 0.05 were considered significant in comparing populations within groups. The graph representation in figure 6A is pooled data from two independent EL4 tumor growth experiments and figure 6B is a representative graph of 2 independent Panco tumor experiments.

References

    1. Almand B, Clark JI, Nikitina E, van Beynen J, English NR, Knight SC, Carbone DP, Gabrilovich DI. Increased production of immature myeloid cells in cancer patients: a mechanism of immunosuppression in cancer. J Immunol. 2001;166(1):678–689. - PubMed
    1. Basu S, Hodgson G, Zhang HH, Katz M, Quilici C, Dunn AR. Emergency” granulopoiesis in G-CSF-deficient mice in response to Candida albicans infection. Blood. 2000;95(12):3725–3733. - PubMed
    1. Bronte V, Zanovello P. Regulation of immune responses by L-arginine metabolism. Nat Rev Immunol. 2005;5(8):641–654. - PubMed
    1. Chandra R, Villanueva E, Feketova E, Machiedo GW, Hasko G, Deitch EA, Spolarics Z. Endotoxemia down-regulates bone marrow lymphopoiesis but stimulates myelopoiesis: the effect of G6PD deficiency. J Leukoc Biol. 2008;83(6):1541–1550. - PMC - PubMed
    1. Cheng F, Lienlaf M, Perez-Villarroel P, Wang HW, Lee C, Woan K, Woods D, Knox T, Bergman J, Pinilla-Ibarz J, Kozikowski A, Seto E, Sotomayor EM, Villagra A. Divergent roles of histone deacetylase 6 (HDAC6) and histone deacetylase 11 (HDAC11) on the transcriptional regulation of IL10 in antigen presenting cells. Mol Immunol. 2014;60(1):44–53. - PMC - PubMed

Publication types