Clinical Trial
. 2014 Dec;22(12):2142-2154.
doi: 10.1038/mt.2014.157. Epub 2014 Aug 26.

Combining viral vectored and protein-in-adjuvant vaccines against the blood-stage malaria antigen AMA1: report on a phase 1a clinical trial

Affiliations
Clinical Trial

Combining viral vectored and protein-in-adjuvant vaccines against the blood-stage malaria antigen AMA1: report on a phase 1a clinical trial

Susanne H Hodgson et al. Mol Ther. 2014 Dec.

Abstract

The development of effective vaccines against difficult disease targets will require the identification of new subunit vaccination strategies that can induce and maintain effective immune responses in humans. Here we report on a phase 1a clinical trial using the AMA1 antigen from the blood-stage Plasmodium falciparum malaria parasite delivered either as recombinant protein formulated with Alhydrogel adjuvant with and without CPG 7909, or using recombinant vectored vaccines--chimpanzee adenovirus ChAd63 and the orthopoxvirus MVA. A variety of promising "mixed-modality" regimens were tested. All volunteers were primed with ChAd63, and then subsequently boosted with MVA and/or protein-in-adjuvant using either an 8- or 16-week prime-boost interval. We report on the safety of these regimens, as well as the T cell, B cell, and serum antibody responses. Notably, IgG antibody responses primed by ChAd63 were comparably boosted by AMA1 protein vaccine, irrespective of whether CPG 7909 was included in the Alhydrogel adjuvant. The ability to improve the potency of a relatively weak aluminium-based adjuvant in humans, by previously priming with an adenoviral vaccine vector encoding the same antigen, thus offers a novel vaccination strategy for difficult or neglected disease targets when access to more potent adjuvants is not possible.


Figures

Figure 1
Figure 1
VAC044 flow chart of study design and volunteer recruitment. Eighteen volunteers were excluded following screening for the following reasons: prior malaria exposure (two volunteers); excessive alcohol consumption (one volunteer); proteinuria (one volunteer); positive antinuclear antibody at screening (two volunteers); nickel allergy (two volunteers); anemia (one volunteer); psychiatric history (four volunteers); hematuria (one volunteer); consent withdrawn prior to enrolment (four volunteers). All immunizations were administered intramuscularly with sequential vaccines administered into the deltoid of alternating arms. Two volunteers in Group 1 withdrew from the study 56 days post-ChAd63 AMA1 for personal reasons. One volunteer in Group 5 withdrew from the study 57 days post-ChAd63 AMA1 for personal reasons and was replaced with a new volunteer, thus n = 8 recruited into this group. Throughout the paper the immunization regimens are referred to as defined in the Group boxes, e.g., AMP+ = ChAd63 prime, MVA boost, AMA1-C1 protein-in-Alhydrogel + CP7909 boost with 8-week intervals; A_P+ = ChAd63 prime, AMA1-C1 protein-in-Alhydrogel + CP7909 boost with a 16-week interval. Where the “AM” regimen is referred to, this relates to ChAd63 prime, MVA boost with an 8-week interval from Group 1 (before the protein vaccine boost).
Figure 2
Figure 2
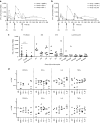
T cell responses of mixed-modality AMA1 immunization regimens. T cell responses were assessed in each group by ex vivo IFN-γ ELISPOT using fresh peripheral blood mononuclear cell (PBMC). All volunteers received the same prime with ChAd63 AMA1 on d0. Median responses are shown over time for the 3D7 AMA1 allele in (a) Groups 1, 2, and 3 which all received a booster immunization on day 56, and (b) Groups 1, 4, and 5 which all received a booster immunization on d112, (note Group 1 received a booster immunization at both of these time-points). (c) Median and individual IFN-γ ELISPOT responses are shown for key time-points: all volunteers combined before boosting at days 14 and 56 (n = 31) and day 112 (n = 13); 1 week after the booster immunizations (d63 and d119); and the final time-point of follow-up 24 weeks after the last immunization (d224 or d280). ***P < 0.0001, Wilcoxon matched-pairs signed rank test. (d) Frozen PBMC from 4 weeks post-booster immunization = d84 (AM, AP+, AP−) and d140 (AMP+, A_P+, and A_M), were restimulated with a pool of 3D7 AMA1-specific peptides and assayed by intracellular cytokine staining for all volunteers (except for one in Group 5 (A_M) for which cells were not available). Individual and group median responses are shown for the % CD4+ (top) and CD8+ (bottom) T cells positive for CD107a, IFN-γ, IL-2, or TNF-α. Any values <0.002% are not shown.
Figure 3
Figure 3
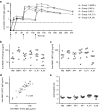
Humoral responses of mixed-modality AMA1 immunization regimens. Serum IgG antibody responses were assessed in each group by anti-AMA1 enzyme-linked immunosorbent assay (ELISA). All volunteers received the same prime with ChAd63 AMA1 on d0. (a) Median responses are shown over time for all groups for the FVO AMA1 allele. The dashed line indicates the limit of detection in the assay. (b) Median and individual ELISA responses against FVO AMA1 are shown four weeks after all booster vaccinations: day 84 following AM, AP+, and AP− immunization, and day 140 following AMP+, A_P+, and A_M immunization. (c) The same as in b except the ELISA was performed for 3D7 AMA1. (d) Concordance between the anti-AMA1 total IgG ELISA readouts between the two allelic variants of AMA1 (responses as shown in b and c). Linear regression r2 value is shown; slope = 0.96 (95% CI: 0.79–1.13); Y-intercept = 8.9 µg/ml (95% CI: 0.23–17.6) (n = 36). (e) Avidity of serum IgG responses was assessed by NaSCN-displacement 3D7 AMA1 ELISA and is reported as the molar (mol/l) concentration of NaSCN required to reduce the starting OD in the ELISA by 50% (IC50). Median and individual responses are shown. Regimens and time-points as in b and c.
Figure 4
Figure 4
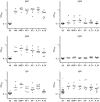
Antibody isotype profiles of mixed-modality AMA1 immunization regimens. Isotype profiles of serum antibody responses were assessed by 3D7 AMA1 enzyle-linked immunosorbent assay (ELISA). Responses are shown at baseline (d0) for all volunteers and then four weeks after all booster vaccinations: day 84 following AM, AP+, and AP− immunization, and day 140 following AMP+, A_P+, and A_M immunization. In all panels, individual and median responses are shown.
Figure 5
Figure 5
B cell responses of mixed-modality AMA1 immunization regimens. (a) AMA1-specific antibody-secreting cell (ASC) responses were assessed in each group by ex vivo ELISPOT using 3D7 + FVO AMA1 protein and fresh peripheral blood mononuclear cell (PBMC) from selected time-points post-booster vaccinations (including day of vaccination, and then 1, 4, 7, and 28 days thereafter). Individual and median responses are shown for each group, (note Group 1 received a booster immunization on both d56 and d112). Responses are reported as AMA1-specific ASC / million PBMC used in the assay. Intergroup comparisons, and AMA1-specific ASC reported as % total IgG ASC are shown in Supplementary Figure S6. (b) AMA1-specific memory B cell (mBC) responses were assessed in each group by ELISPOT assay using 3D7 + FVO AMA1 protein. Frozen PBMC were thawed and underwent a 6-day polyclonal restimulation during which ASC are derived from mBC, before testing in the assay. Responses are shown over time in Supplementary Figure S7. Here individual and median responses are reported four weeks after all booster vaccinations: day 84 following AM, AP+, and AP− immunization, and day 140 following AMP+, A_P+, and A_M immunization. (c) As for b, except the late time-point 12 weeks postfinal immunization is reported (d140/d196). *P < 0.05, Kruskal–Wallis test with Dunn's correction for multiple comparisons.
Figure 6
Figure 6
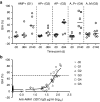
Assessment of functional growth inhibitory activity (GIA) induced by mixed-modality AMA1 immunization regimens. (a) In vitro GIA of purified IgG was assessed at 10 mg/ml against 3D7 clone P. falciparum parasites. Individual data and medians are shown for each group at d0 (baseline), and then 4 weeks following all booster vaccinations (d84 or d140). Responses >20% are typically regarded as positive. (b) Relationship between GIA and anti-3D7 AMA1 serum IgG concentrations measured by enzyme-linked immunosorbent assay (ELISA). Nonlinear regression curve is also shown (n = 67). The EC50 (level of anti-3D7 AMA1 response in this ELISA assay that gives 50% GIA, indicated by the dotted line) was 69.7 µg/ml, (95% CI: 50.2–97.0).

References

    1. World Health Organization World Malaria Report 2012. World Malaria Report. 2012;2012:1–249.
    1. Murray CJ, Rosenfeld LC, Lim SS, Andrews KG, Foreman KJ, Haring D, et al. Global malaria mortality between 1980 and 2010: a systematic analysis. Lancet. 2012;379:413–431. - PubMed
    1. Birkett AJ, Moorthy VS, Loucq C, Chitnis CE, Kaslow DC. Malaria vaccine R&D in the Decade of Vaccines: breakthroughs, challenges and opportunities. Vaccine. 2013;31 suppl. 2:B233–B243. - PubMed
    1. Agnandji ST, Lell B, Fernandes JF, Abossolo BP, Methogo BG, Kabwende AL, et al. A phase 3 trial of RTS,S/AS01 malaria vaccine in African infants. N Engl J Med. 2012;367:2284–2295. - PMC - PubMed
    1. Hill AV. Vaccines against malaria. Philos Trans R Soc Lond B Biol Sci. 2011;366:2806–2814. - PMC - PubMed

Publication types

MeSH terms