

HIV-1 and HIV-2 differentially mature plasmacytoid dendritic cells into IFN-producing cells or APCs
- PMID: 25156368
- PMCID: PMC4822683
- DOI: 10.4049/jimmunol.1400860
HIV-1 and HIV-2 differentially mature plasmacytoid dendritic cells into IFN-producing cells or APCs
Abstract
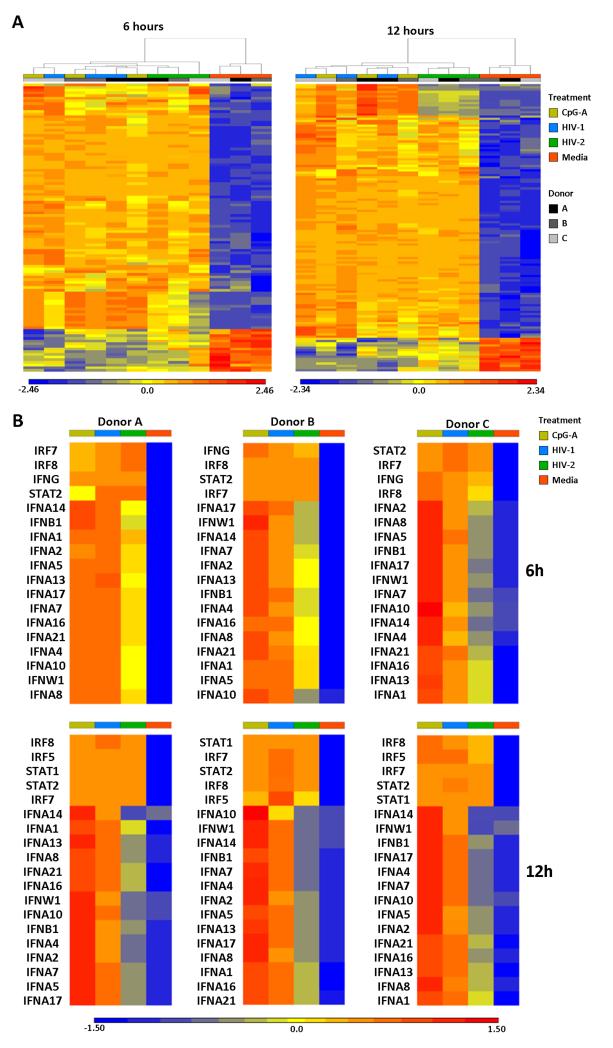
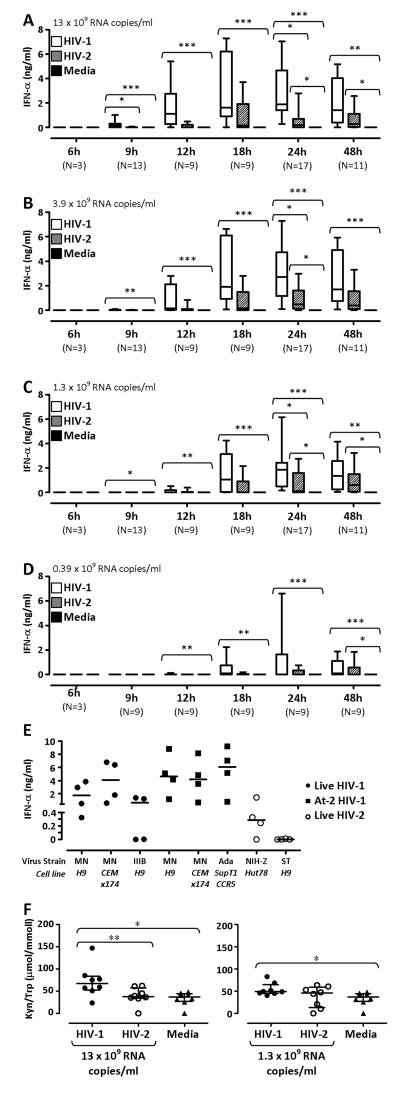
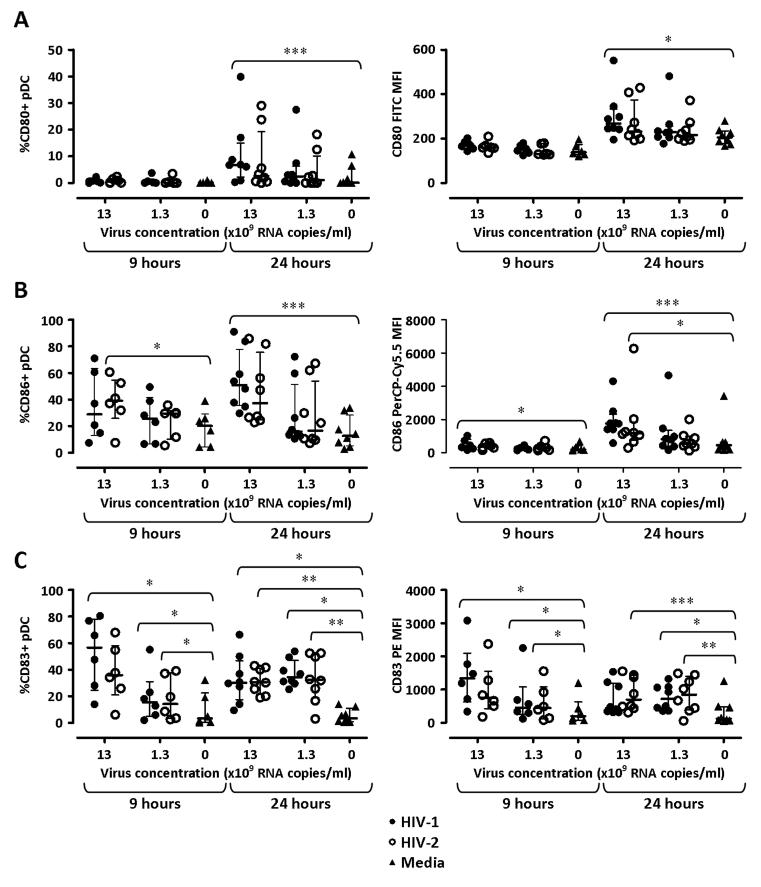
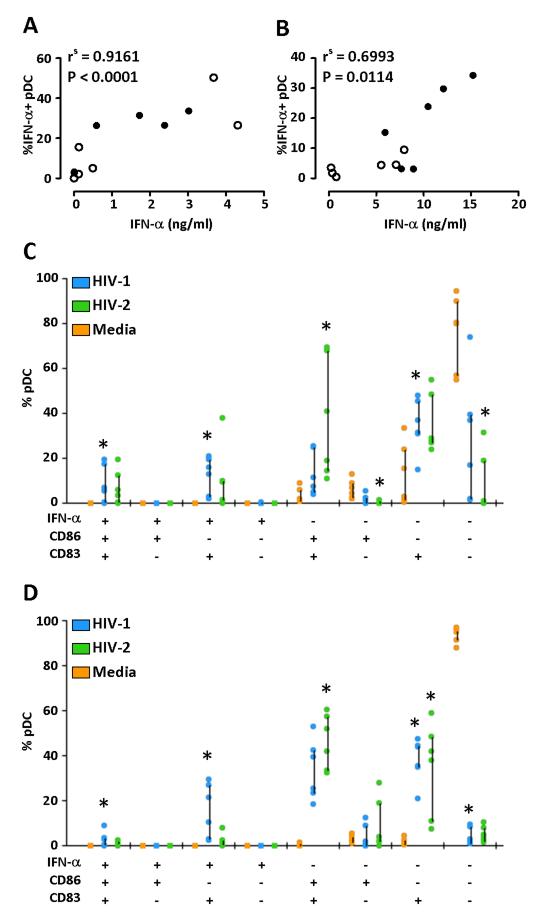
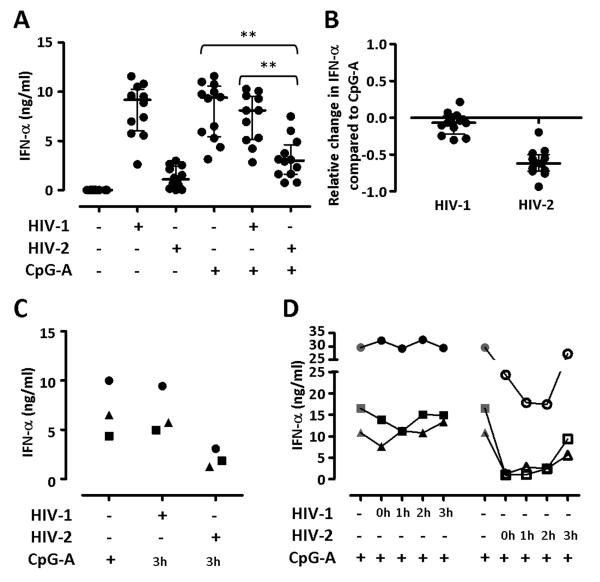
HIV-1 causes a progressive impairment of immune function. HIV-2 is a naturally attenuated form of HIV, and HIV-2 patients display a slow-progressing disease. The leading hypothesis for the difference in disease phenotype between HIV-1 and HIV-2 is that more efficient T cell-mediated immunity allows for immune-mediated control of HIV-2 infection, similar to that observed in the minority of HIV-1-infected long-term nonprogressors. Understanding how HIV-1 and HIV-2 differentially influence the immune function may highlight critical mechanisms determining disease outcome. We investigated the effects of exposing primary human peripheral blood cells to HIV-1 or HIV-2 in vitro. HIV-2 induced a gene expression profile distinct from HIV-1, characterized by reduced type I IFN, despite similar upregulation of IFN-stimulated genes and viral restriction factors. HIV-2 favored plasmacytoid dendritic cell (pDC) differentiation into cells with an APC phenotype rather than IFN-α-producing cells. HIV-2, but not HIV-1, inhibited IFN-α production in response to CpG-A. The balance between pDC maturation into IFN-α-producing cells or development of an APC phenotype differentiates the early response against HIV-1 and HIV-2. We propose that divergent paths of pDC differentiation driven by HIV-1 and HIV-2 cause the observed differences in pathogenicity between the two viruses.
Copyright © 2014 by The American Association of Immunologists, Inc.
Figures
Similar articles
-
Plasmacytoid dendritic cells in HIV infection: striking a delicate balance.J Leukoc Biol. 2010 Apr;87(4):609-20. doi: 10.1189/jlb.0909635. Epub 2010 Feb 9. J Leukoc Biol. 2010. PMID: 20145197 Free PMC article. Review.
-
HIV-infected cells are major inducers of plasmacytoid dendritic cell interferon production, maturation, and migration.Virology. 2005 Dec 20;343(2):256-66. doi: 10.1016/j.virol.2005.09.059. Epub 2005 Nov 8. Virology. 2005. PMID: 16278001
-
Characterization of the Plasmacytoid Dendritic Cell Response to Transmitted/Founder and Nontransmitted Variants of HIV-1.J Virol. 2018 Sep 12;92(19):e00157-18. doi: 10.1128/JVI.00157-18. Print 2018 Oct 1. J Virol. 2018. PMID: 29997203 Free PMC article.
-
Human immunodeficiency virus viremia induces plasmacytoid dendritic cell activation in vivo and diminished alpha interferon production in vitro.J Virol. 2008 Apr;82(8):3997-4006. doi: 10.1128/JVI.01545-07. Epub 2008 Feb 6. J Virol. 2008. PMID: 18256146 Free PMC article.
-
HIV-1 infection and induction of interferon alpha in plasmacytoid dendritic cells.Curr Opin HIV AIDS. 2011 Sep;6(5):373-8. doi: 10.1097/COH.0b013e328349592a. Curr Opin HIV AIDS. 2011. PMID: 21734568 Review.
Cited by
-
HIV-2 infects resting CD4+ T cells but not monocyte-derived dendritic cells.Retrovirology. 2015 Jan 13;12:2. doi: 10.1186/s12977-014-0131-7. Retrovirology. 2015. PMID: 25582927 Free PMC article.
-
Dendritic Cell Immune Responses in HIV-1 Controllers.Curr HIV/AIDS Rep. 2017 Feb;14(1):1-7. doi: 10.1007/s11904-017-0345-0. Curr HIV/AIDS Rep. 2017. PMID: 28110421 Free PMC article. Review.
-
Pro-inflammatory feedback loops define immune responses to pathogenic Lentivirus infection.Genome Med. 2024 Feb 5;16(1):24. doi: 10.1186/s13073-024-01290-y. Genome Med. 2024. PMID: 38317183 Free PMC article.
-
Deficient humoral responses and disrupted B-cell immunity are associated with fatal SFTSV infection.Nat Commun. 2018 Aug 20;9(1):3328. doi: 10.1038/s41467-018-05746-9. Nat Commun. 2018. PMID: 30127439 Free PMC article.
-
Insight into HIV-2 latency may disclose strategies for a cure for HIV-1 infection.J Virus Erad. 2017 Jan 1;3(1):7-14. doi: 10.1016/S2055-6640(20)30300-9. J Virus Erad. 2017. PMID: 28275453 Free PMC article.
References
-
- Picker LJ, Watkins DI. HIV pathogenesis: The first cut is the deepest. Nature Immunology. 2005;6:430–432. - PubMed
-
- Sabado RL, O’Brien M, Subedi A, Qin L, Hu N, Taylor E, Dibben O, Stacey A, Fellay J, Shianna KV, Siegal F, Shodell M, Shah K, Larsson M, Lifson J, Nadas A, Marmor M, Hutt R, Margolis D, Garmon D, Markowitz M, Valentine F, Borrow P, Bhardwaj N. Evidence of dysregulation of dendritic cells in primary HIV infection. Blood. 2010;116:3839–3852. - PMC - PubMed
-
- Boasso A, Royle CM, Doumazos S, Aquino VN, Biasin M, Piacentini L, Tavano B, Fuchs D, Mazzotta F, Lo Caputo S, Shearer GM, Clerici M, Graham DR. Overactivation of plasmacytoid dendritic cells inhibits antiviral T-cell responses: a model for HIV immunopathogenesis. Blood. 2011;118:5152–5162. - PMC - PubMed
Publication types
MeSH terms
Substances
Grants and funding
LinkOut - more resources
Full Text Sources
Other Literature Sources
Medical
Molecular Biology Databases
Miscellaneous
