. 2014 Aug 26:5:4686.
doi: 10.1038/ncomms5686.

Unconventionally secreted effectors of two filamentous pathogens target plant salicylate biosynthesis

Affiliations

Unconventionally secreted effectors of two filamentous pathogens target plant salicylate biosynthesis

Tingli Liu et al. Nat Commun. .

Abstract

Plant diseases caused by fungi and oomycetes pose an increasing threat to food security and ecosystem health worldwide. These filamentous pathogens, while taxonomically distinct, modulate host defense responses by secreting effectors, which are typically identified based on the presence of signal peptides. Here we show that Phytophthora sojae and Verticillium dahliae secrete isochorismatases (PsIsc1 and VdIsc1, respectively) that are required for full pathogenesis. PsIsc1 and VdIsc1 can suppress salicylate-mediated innate immunity in planta and hydrolyse isochorismate in vitro. A conserved triad of catalytic residues is essential for both functions. Thus, the two proteins are isochorismatase effectors that disrupt the plant salicylate metabolism pathway by suppressing its precursor. Furthermore, these proteins lack signal peptides, but exhibit characteristics that lead to unconventional secretion. Therefore, this secretion pathway is a novel mechanism for delivering effectors and might play an important role in host-pathogen interactions.


Figures
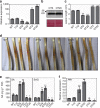
Figure 1
Figure 1. PsIsc1 is a virulence factor in P. sojae.
(a) Relative levels of PsIsc1 transcripts in P. sojae transformants measured using qRT–PCR. Relative transcript levels were standardized using P. sojae actin gene. T10 showed no significant transcriptional changes and served as a control. (b) Western blotting of proteins from P. sojae transformants expressing PsIsc1-His (OT3 and OT20). Anti-His antibody was used and a band at the expected size was detected (upper panel). Total proteins were stained using Ponceau S (lower panel). (c) Lesion lengths of soybean-etiolated seedling hypocotyls inoculated with 100 zoospores (36 hpi). (d) Phenotypes of soybean-etiolated seedlings inoculated with P. sojae transgenic lines. Typical photos taken at 36 hpi are shown. (e) Free SA and SAG levels (12 hpi) in soybean tissues infected with the WT strain and P. sojae transformants. FW, fresh weight. (f) Relative expression of soybean PR1 in plants infected with the WT strain and transgenic lines at 12 hpi. Expression was normalized against soybean actin. In af, bars represent the s.e. from at least three independent replicates. Asterisks indicate significant differences (*P<0.05; **P<0.01; Dunnett’s test) between each transgenic line and the WT control.
Figure 2
Figure 2. Functional VdIsc1 or PsIsc1 is required for full V. dahliae virulence.
(a) Disease symptoms on cotton plants were scored at 15 dpi with the indicated strains. The disease grade is depicted in Supplementary Fig. 3. The total number of infected plants is indicated above each column (**P<0.01; t-test). V991 represents the WT V. dahliae isolate; Δ1-12 (V991ΔVdIsc1-12) and Δ1-18 (V991ΔVdIsc1-18) represent two strains in which VdIsc1 was deleted; Δ1-12VdIsc1, Δ1-12VdIsc1A3, Δ1-12PsIsc1 and Δ1-12PsIsc1A3 represent, respectively, Δ1-12 complemented with VdIsc1, with a VdIsc1 mutant encoding three key amino acid substitutions (D26A, K100A and C133A), with PsIsc1 and with a PsIsc1 mutant encoding comparable substitutions (D25A, K90A and C124A; Supplementary Fig. 2). All complementing constructs used the Aspergillus nidulans trpC promoter. (b) Free SA and SAG levels in cotton roots at 14 dpi. (c) Relative levels of cotton PR1 transcripts measured using qRT–PCR at 12 hpi. Expression was normalized against the constitutively expressed cotton gene Histone3. In b and c, the data represent the mean±s.d.; **P<0.01 (Dunnett’s test) between WT and each transgenic line. (d) Disease symptoms of the Arabidopsis WT and NahG-transformed plants. The disease grades are described in the Methods. The total number of infected plants is shown above each column (**P<0.01; t-test).
Figure 3
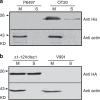
Figure 3. PsIsc1 and VdIsc1 are secreted proteins.
PsIsc1-His (a) and VdIsc1-HA (b) were expressed in P. sojae (OT20) and V. dahliae (Δ1-12VdIsc1), respectively. Proteins extracted from mycelia (M) and culture supernatants (S) were analysed using western blotting with anti-His, -HA or -α-actin antibodies, as indicated. Extracts and supernatants from non-transformed P. sojae P6497 and V. dahliae V991 were used as controls for antibody specificity.
Figure 4
Figure 4. PsIsc1 can replace the translocation domain of Avr1b.
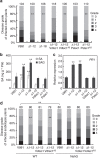
(a) PsIsc1 preferentially accumulates in haustoria. P. sojae-infected hyphae were observed using confocal microscopy at 10 hpi. P. sojae expressing Avr1b-mRFP showed specific haustorial accumulation (indicated by the arrow) of fluorescent Avr1b (red, upper panel), whereas PsIsc1-mRFP accumulated preferentially in haustoria (red, middle panel). P6497 expressing mRFP served as a control (lower panel). Scale bars, 20 μm. The arrow indicated haustoria were shown with tenfold magnification. (b) Structure of the fusion of full-length PsIsc1 and the C terminus of Avr1b (Avr1bCt: aa, 66–138, removing the signal peptide and RxLR-dEER domain). (c) Western blotting of proteins from P. sojae transformants expressing Avr1b-mRFP, Avr1bCt-mRFP and PsIsc1-Avr1bCt (PsIsc1-Avr1bCt1 and PsIsc1-Avr1bCt3). The P. sojae isolate P6497 served as a control for antibody specificity. (d) The phenotypes of hypocotyls from soybean cultivars HARO13 (Rps1b) and Williams (rps). Photographs were taken 2 dpi.
Figure 5
Figure 5. PsIsc1 and VdIsc1 suppress disease resistance.
(a) Western blotting of the indicated transiently expressed proteins in N. benthamiana using anti-GFP antibodies. (b) Phenotypes of leaves transiently expressing the indicated genes inoculated with P. capsici zoospores. Photos were taken at 48 hpi. (c) Lesion diameters of infected regions at 48 hpi, averaged from at least 30 inoculated sites. (d) Free SA (left) and SAG (right) levels (12 hpi) in leaves transiently expressing the indicated genes. (e) Relative levels of PR1 gene transcripts at 12 hpi in infected leaves transiently expressing the indicated genes. (f) Isochorismatase activity by measuring the absorbance at 340 nm. Bacterial EntB and VibB produced by E. coli were used as positive controls. An identical quantity of the tested proteins was purified from plant tissues. VibA generates NADH from DDHB and NAD+ when active ISC was present (producing DDHB from isochorismate); the absorbance of NADH at A340 nm at the indicated time points (seconds) was recorded. (g) Relative DDHB concentrations in plant tissues expressing the indicated genes. The relative DDHB concentration of each tested sample was calculated based on A340 absorbance and the DDHB concentration in GFP-expressing leaves was normalized to 1.0. In a, ce and g, from left to right: GFP, VdIsc1, PsIsc1, VdIsc1A3 and PsIsc1A3. **P<0.01 (Dunnett’s test).
Figure 6
Figure 6. Functional analysis of the N termini of PsIsc1 and VdIsc1.
(a) Phenotypes of cotton seedlings inoculated with the indicated strains. The photos were taken at 15 dpi and a typical seedling is shown as an example for each line. The numerator indicates the average disease index, which is calculated based on the disease grades of the individual inoculated seedlings and the total number (denominator). (b) The disease symptoms of leaves transiently expressing the indicated genes that were inoculated with P. capsici zoospores. Photos were taken at 48 hpi. The numbers indicate the lesion diameters of infected regions that were scored at 48 hpi and represent the mean at least 30 inoculated sites. (c) The relative levels of SA, SAG (left axis) and PR1 transcripts (right axis) at 12 hpi in infected leaves transiently expressing the indicated genes. *P<0.01 (Dunnett’s test).
Figure 7
Figure 7. Pathogen effectors subverting plant SA biosynthesis.
Pathogens use cell-entering effectors (yellow) to suppress plant SA biosynthesis in distinct manners. Filamentous pathogen-derived enzymatic effectors (circle) inhibit SA accumulation by redirecting its precursors from plastid (darker green) to cytosol (mint green), whereas bacterial effector HopI1 (triangle) depresses SA levels by remodelling chloroplast thylakoid structure.

References

    1. Tyler B. M. et al. Phytophthora genome sequences uncover evolutionary origins and mechanisms of pathogenesis. Science 313, 1261–1266 (2006). - PubMed
    1. Klosterman S. J. et al. Comparative genomics yields insights into niche adaptation of plant vascular wilt pathogens. PLoS Pathog. 7, e1002137 (2011). - PMC - PubMed
    1. Kamoun S. A catalogue of the effector secretome of plant pathogenic oomycetes. Annu. Rev. Phytopathol. 44, 41–60 (2006). - PubMed
    1. Richards T. A. et al. Evolution of filamentous plant pathogens: gene exchange across eukaryotic kingdoms. Curr. Biol. 16, 1857–1864 (2006). - PubMed
    1. Jones J. D. & Dangl J. L. The plant immune system. Nature 444, 323–329 (2006). - PubMed

Publication types

MeSH terms