. 2014 Nov;82(11):4802-12.
doi: 10.1128/IAI.01856-14. Epub 2014 Aug 25.

Influenza A virus alters pneumococcal nasal colonization and middle ear infection independently of phase variation

Affiliations

Influenza A virus alters pneumococcal nasal colonization and middle ear infection independently of phase variation

John T Wren et al. Infect Immun. 2014 Nov.

Abstract

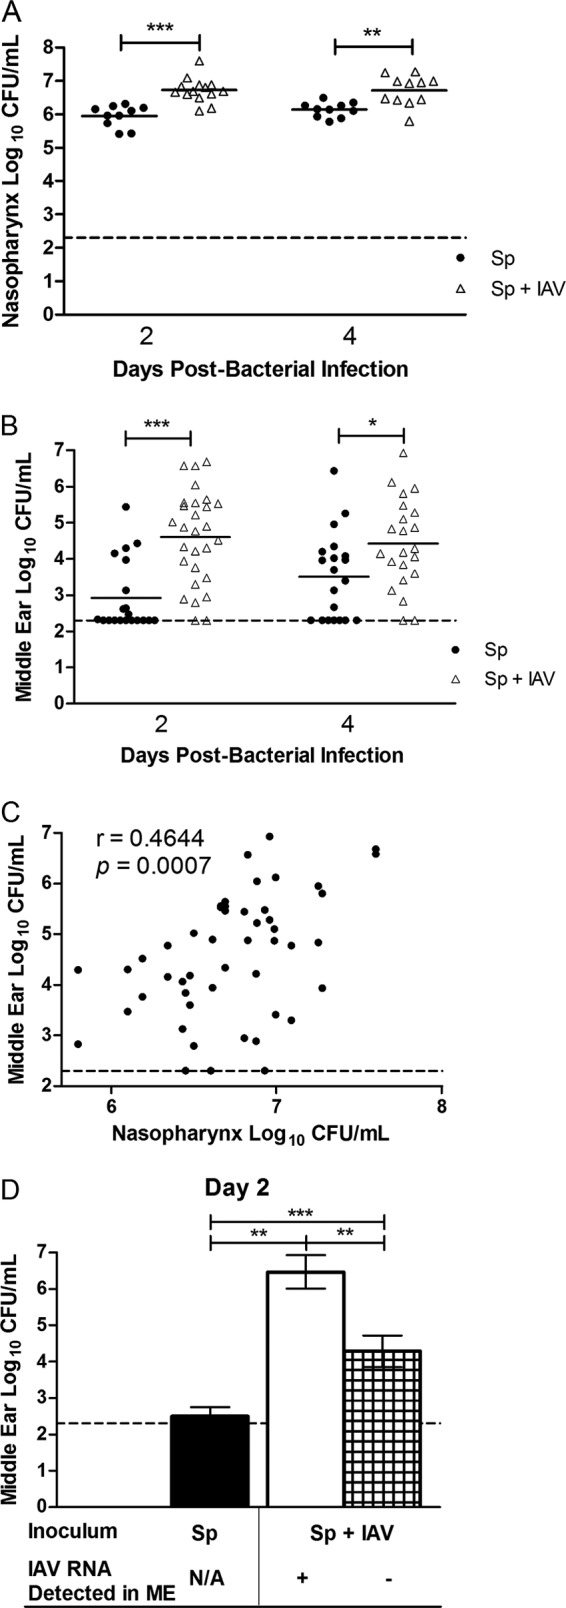
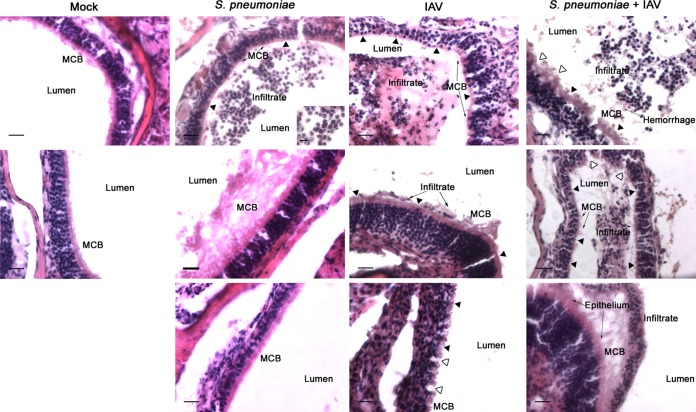
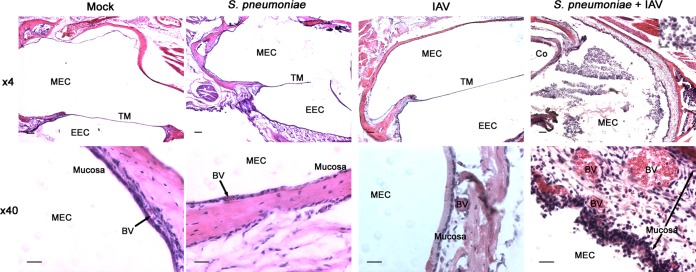
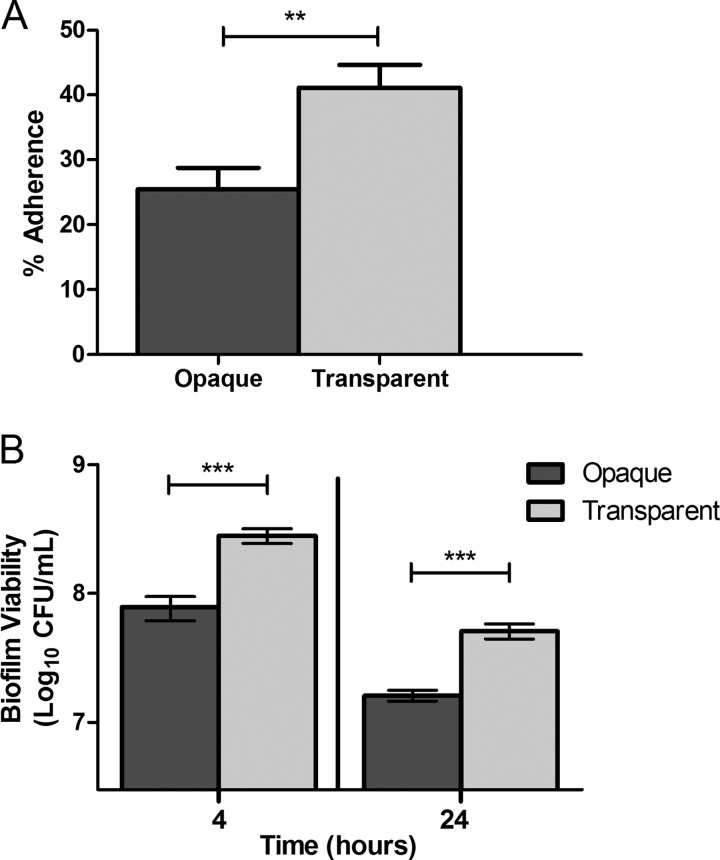
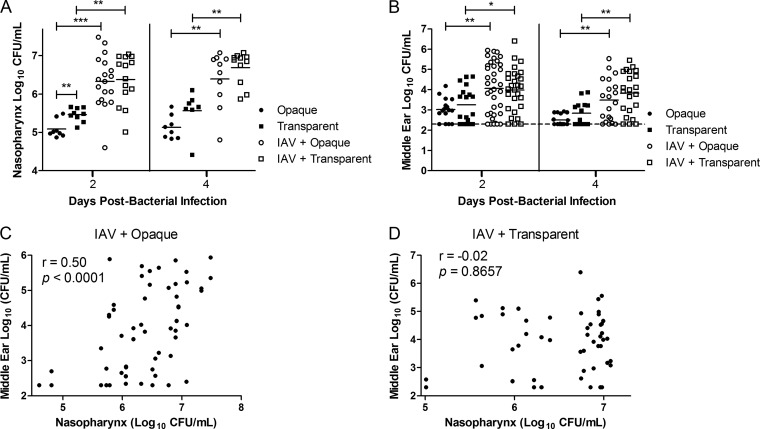
Streptococcus pneumoniae (pneumococcus) is both a widespread nasal colonizer and a leading cause of otitis media, one of the most common diseases of childhood. Pneumococcal phase variation influences both colonization and disease and thus has been linked to the bacteria's transition from colonizer to otopathogen. Further contributing to this transition, coinfection with influenza A virus has been strongly associated epidemiologically with the dissemination of pneumococci from the nasopharynx to the middle ear. Using a mouse infection model, we demonstrated that coinfection with influenza virus and pneumococci enhanced both colonization and inflammatory responses within the nasopharynx and middle ear chamber. Coinfection studies were also performed using pneumococcal populations enriched for opaque or transparent phase variants. As shown previously, opaque variants were less able to colonize the nasopharynx. In vitro, this phase also demonstrated diminished biofilm viability and epithelial adherence. However, coinfection with influenza virus ameliorated this colonization defect in vivo. Further, viral coinfection ultimately induced a similar magnitude of middle ear infection by both phase variants. These data indicate that despite inherent differences in colonization, the influenza A virus exacerbation of experimental middle ear infection is independent of the pneumococcal phase. These findings provide new insights into the synergistic link between pneumococcus and influenza virus in the context of otitis media.


Figures

FIG 1
FIG 1
Influenza A virus exacerbates nasal colonization and middle ear infection by S. pneumoniae. Mice were infected intranasally with influenza A virus (IAV) PR8/34-GFP and 4 days later infected with S. pneumoniae (Sp) EF3030. Graphs show the magnitude of nasal colonization (A) and middle ear infection (B) by S. pneumoniae in the tissue homogenates from days 2 and 4 post-bacterial infection (corresponding to days 6 and 8 post-viral infection). Each data point represents a single nasopharynx or ear, and the data are pooled from two replicate experiments. The short, solid horizontal lines denote the geometric mean, and the horizontal dotted line represents the limit of detection of the assay. Statistical analysis was performed using a two-tailed Mann-Whitney U test (*, P < 0.05; **, P < 0.01; ***, P < 0.001). (C) Correlation between nasal colonization density of S. pneumoniae and the middle ear pneumococcal burden in coinfected mice. Each ear is correlated to its respective nasopharynx. The data contain both time points and are pooled from two replicate experiments. Statistical analysis was performed using Spearman's rank correlation test and is denoted by Spearman's rank correlation coefficient (r) and P value. (D) Middle ear (ME) pneumococcal burden at day 2 post-bacterial infection in mice infected with S. pneumoniae alone (black bar), coinfected with IAV and possessing detectable viral RNA in the middle ear (white bar), or coinfected with IAV but containing no detectable viral RNA in the middle ear (hatched bar) from a separate experiment. Each bar represents the geometric mean ± 95% confidence intervals. The presence of IAV RNA was detected by qRT-PCR, and no IAV RNA was detectable in the middle ear by day 4 post-bacterial infection (day 8 post-viral infection). Data are pooled from two replicate experiments. Statistical analysis was performed using a two-tailed Mann-Whitney U test (**, P < 0.01; ***, P < 0.001). N/A, not applicable.
FIG 2
FIG 2
Influenza virus induces nasal epithelial changes. Representative histological images of the lateral wall of the nasal cavity from mice (n ≥ 4) infected intranasally with influenza A virus (IAV) and 4 days later infected by S. pneumoniae from both days 2 and 4 post-bacterial infection (corresponding to days 6 and 8 post-viral infection). Representative images from mock-infected mice and mice infected with S. pneumoniae alone or IAV alone are also shown. Tissues were stained with hematoxylin and eosin and examined microscopically at a magnification of ×40. Scale bar, 20 μm. Areas in the insets were examined at a magnification of ×60 (scale bar, 10 μm). Relevant structures are labeled, including the mucociliary border (MCB). Filled arrowheads mark areas of ciliary denudation; open arrowheads indicate areas of epithelial disruption.
FIG 3
FIG 3
Middle ear inflammation and infiltrate are increased during coinfection. Representative histological images of the middle ear (n ≥ 8) from mice infected intranasally with influenza A virus (IAV) and 4 days later infected by S. pneumoniae from both days 2 and 4 post-bacterial infection (corresponding to days 6 and 8 post-viral infection). Representative images from mock-infected mice and mice infected with S. pneumoniae alone or IAV alone are also shown. Tissues were stained with hematoxylin and eosin. The samples were examined microscopically at magnifications of ×4 and ×40, and the scale bars represent 100 μm and 20 μm, respectively. Areas in the insets were examined at a magnification of ×60 (scale bar, 10 μm). Relevant structures are labeled, including the middle ear cavity (MEC), tympanic membrane (TM), external ear canal (EEC), and blood vessels (BV).
FIG 4
FIG 4
The transparent phase displays enhanced epithelial adherence and biofilm viability in vitro. (A) Adherence of S. pneumoniae opacity variants to Detroit 562 nasopharyngeal epithelial cells after 60 min, expressed as the percentage of adherent bacteria relative to the inoculum. Bars represent the means ± standard errors of the means. The experiment was performed with three biological replicates per opacity variant and six variants of each phase. Statistical analysis was performed using a two-tailed Student's t test (**, P < 0.01). (B) Viability of pneumococcal opacity variants from 4- and 24-h static biofilms. Bars represent the means ± standard errors of the means of three replicate experiments. Statistical analysis was performed using a two-tailed Student's t test (**, P < 0.01; ***, P < 0.001).
FIG 5
FIG 5
Coinfection with influenza virus alters nasal colonization and middle ear infection by both the opaque and transparent phases. Mice that had been either mock infected or infected intranasally with influenza A virus (IAV) 4 days prior were infected with either the opaque- or transparent-phase variant of S. pneumoniae EF3030. Graphs show the magnitude of nasal colonization (A) and middle ear infection (B) by S. pneumoniae in the tissue homogenates from days 2 and 4 post-bacterial infection (corresponding to days 6 and 8 post-viral infection). Each data point denotes a single nasopharynx or ear, and the data are pooled from two replicate experiments. The short, solid horizontal lines indicate the geometric mean, and the dotted line represents the limit of detection of the assay. Statistical analysis was performed using a two-tailed Mann-Whitney U test (*, P < 0.05; ** P < 0.01; *** P < 0.001). (C and D) Correlations between nasal colonization density of S. pneumoniae and the middle ear pneumococcal titers in mice coinfected with IAV and either the opaque variant (C) or the transparent variant (D). Each ear is correlated to its respective nasopharynx. The data contain both time points and are pooled from two replicate experiments. Statistical analysis was performed using Spearman's rank correlation test and is denoted by Spearman's rank correlation coefficient (r) and P value.

References

    1. Ahmed S, Shapiro NL, Bhattacharyya N. 2014. Incremental health care utilization and costs for acute otitis media in children. Laryngoscope 124:301–305. 10.1002/lary.24190. - DOI - PubMed
    1. Rovers MM, Schilder AG, Zielhuis GA, Rosenfeld RM. 2004. Otitis media. Lancet 363:465–473. 10.1016/S0140-6736(04)15495-0. - DOI - PubMed
    1. Casey JR, Kaur R, Friedel VC, Pichichero ME. 2013. Acute otitis media otopathogens during 2008 to 2010 in Rochester, New York. Pediatr. Infect. Dis. J. 32:805–809. 10.1097/INF.0b013e31828d9acc. - DOI - PMC - PubMed
    1. Adegbola RA, Obaro SK, Biney E, Greenwood BM. 2001. Evaluation of Binax Now Streptococcus pneumoniae urinary antigen test in children in a community with a high carriage rate of pneumococcus. Pediatr. Infect. Dis. J. 20:718–719. 10.1097/00006454-200107000-00018. - DOI - PubMed
    1. Ghaffar F, Friedland IR, McCracken GH., Jr 1999. Dynamics of nasopharyngeal colonization by Streptococcus pneumoniae. Pediatr. Infect. Dis. J. 18:638–646. 10.1097/00006454-199907000-00016. - DOI - PubMed

Publication types