

Characterization of urinary tract infection-associated Shiga toxin-producing Escherichia coli
- PMID: 25156739
- PMCID: PMC4249321
- DOI: 10.1128/IAI.01701-14
Characterization of urinary tract infection-associated Shiga toxin-producing Escherichia coli
Abstract
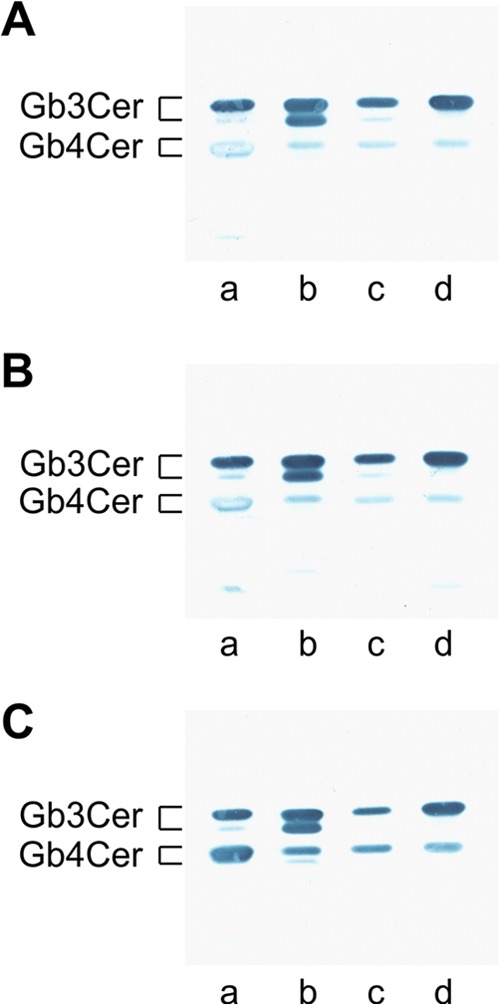
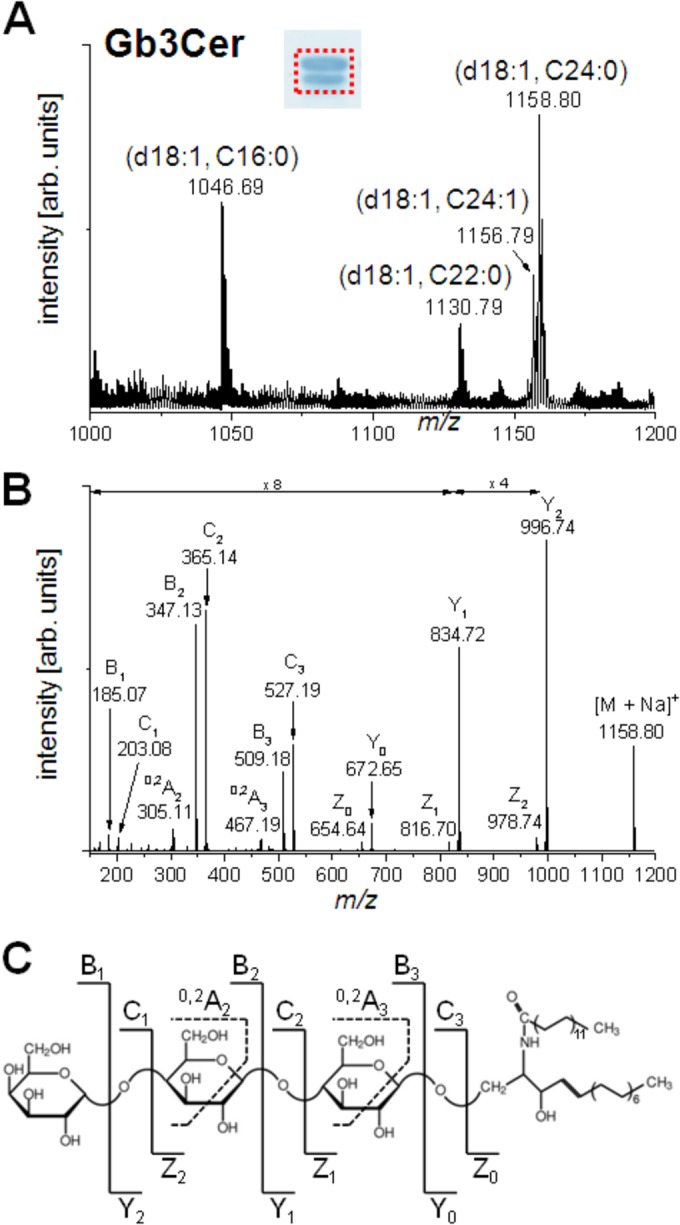
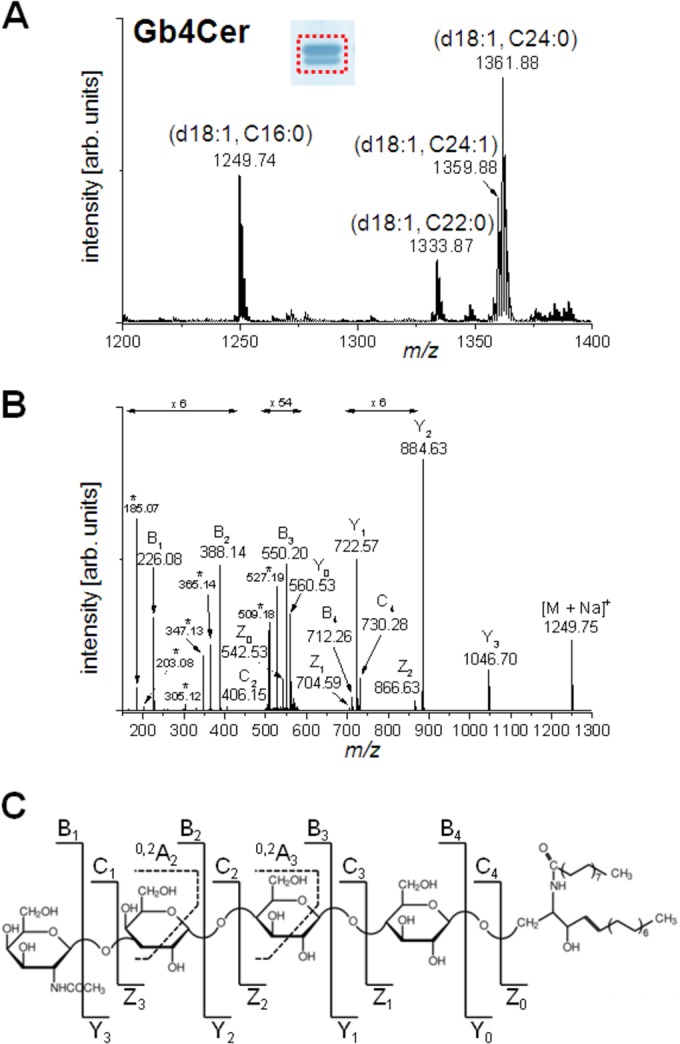
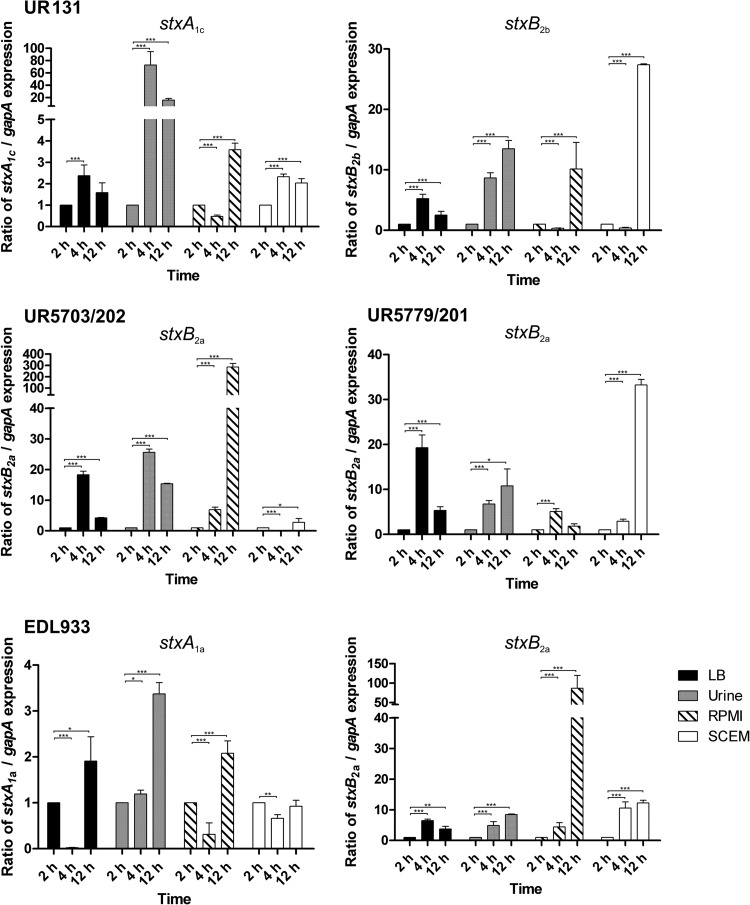
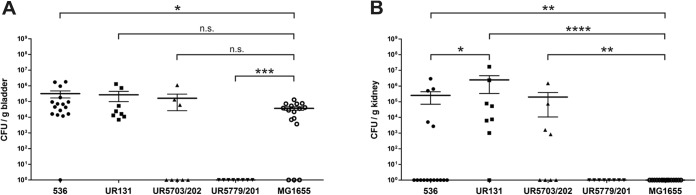
Enterohemorrhagic Escherichia coli (EHEC), a subgroup of Shiga toxin (Stx)-producing E. coli (STEC), is a leading cause of diarrhea and hemolytic-uremic syndrome (HUS) in humans. However, urinary tract infections (UTIs) caused by this microorganism but not associated with diarrhea have occasionally been reported. We geno- and phenotypically characterized three EHEC isolates obtained from the urine of hospitalized patients suffering from UTIs. These isolates carried typical EHEC virulence markers and belonged to HUS-associated E. coli (HUSEC) clones, but they lacked virulence markers typical of uropathogenic E. coli. One isolate exhibited a localized adherence (LA)-like pattern on T24 urinary bladder epithelial cells. Since the glycosphingolipids (GSLs) globotriaosylceramide (Gb3Cer) and globotetraosylceramide (Gb4Cer) are well-known receptors for Stx but also for P fimbriae, a major virulence factor of extraintestinal pathogenic E. coli (ExPEC), the expression of Gb3Cer and Gb4Cer by T24 cells and in murine urinary bladder tissue was examined by thin-layer chromatography and mass spectrometry. We provide data indicating that Stxs released by the EHEC isolates bind to Gb3Cer and Gb4Cer isolated from T24 cells, which were susceptible to Stx. All three EHEC isolates expressed stx genes upon growth in urine. Two strains were able to cause UTI in a murine infection model and could not be outcompeted in urine in vitro by typical uropathogenic E. coli isolates. Our results indicate that despite the lack of ExPEC virulence markers, EHEC variants may exhibit in certain suitable hosts, e.g., in hospital patients, a uropathogenic potential. The contribution of EHEC virulence factors to uropathogenesis remains to be further investigated.
Copyright © 2014, American Society for Microbiology. All Rights Reserved.
Figures
Similar articles
-
Enterohemorrhagic Escherichia coli and a Fresh View on Shiga Toxin-Binding Glycosphingolipids of Primary Human Kidney and Colon Epithelial Cells and Their Toxin Susceptibility.Int J Mol Sci. 2022 Jun 21;23(13):6884. doi: 10.3390/ijms23136884. Int J Mol Sci. 2022. PMID: 35805890 Free PMC article. Review.
-
Shiga toxin-mediated hemolytic uremic syndrome: time to change the diagnostic paradigm?PLoS One. 2007 Oct 10;2(10):e1024. doi: 10.1371/journal.pone.0001024. PLoS One. 2007. PMID: 17925872 Free PMC article.
-
Promoter sequence of Shiga toxin 2 (Stx2) is recognized in vivo, leading to production of biologically active Stx2.mBio. 2013 Oct 1;4(5):e00501-13. doi: 10.1128/mBio.00501-13. mBio. 2013. PMID: 24085779 Free PMC article.
-
Shiga Toxin (Stx)-Binding Glycosphingolipids of Primary Human Renal Cortical Epithelial Cells (pHRCEpiCs) and Stx-Mediated Cytotoxicity.Toxins (Basel). 2021 Feb 12;13(2):139. doi: 10.3390/toxins13020139. Toxins (Basel). 2021. PMID: 33673393 Free PMC article.
-
The 2011 German Enterohemorrhagic Escherichia Coli O104:H4 Outbreak-The Danger Is Still Out There.Curr Top Microbiol Immunol. 2018;416:117-148. doi: 10.1007/82_2018_107. Curr Top Microbiol Immunol. 2018. PMID: 30062592 Review.
Cited by
-
Virulence genes, phylogenetic analysis, and antimicrobial resistance of Escherichia coli isolated from urinary tract infection in hospitalized patients and outpatients.J Appl Genet. 2022 Dec;63(4):805-813. doi: 10.1007/s13353-022-00718-8. Epub 2022 Aug 16. J Appl Genet. 2022. PMID: 35972677
-
Characterization of Uropathogenic Escherichia coli Reveals Hybrid Isolates of Uropathogenic and Diarrheagenic (UPEC/DEC) E. coli.Microorganisms. 2022 Mar 17;10(3):645. doi: 10.3390/microorganisms10030645. Microorganisms. 2022. PMID: 35336220 Free PMC article.
-
Shiga toxin glycosphingolipid receptors of Vero-B4 kidney epithelial cells and their membrane microdomain lipid environment.J Lipid Res. 2015 Dec;56(12):2322-36. doi: 10.1194/jlr.M063040. Epub 2015 Oct 13. J Lipid Res. 2015. PMID: 26464281 Free PMC article.
-
Comparative Genomics and Characterization of Hybrid Shigatoxigenic and Enterotoxigenic Escherichia coli (STEC/ETEC) Strains.PLoS One. 2015 Aug 27;10(8):e0135936. doi: 10.1371/journal.pone.0135936. eCollection 2015. PLoS One. 2015. PMID: 26313149 Free PMC article.
-
Intracellular d-Serine Accumulation Promotes Genetic Diversity via Modulated Induction of RecA in Enterohemorrhagic Escherichia coli.J Bacteriol. 2016 Nov 18;198(24):3318-3328. doi: 10.1128/JB.00548-16. Print 2016 Dec 15. J Bacteriol. 2016. PMID: 27698085 Free PMC article.
References
Publication types
MeSH terms
LinkOut - more resources
Full Text Sources
Other Literature Sources
Medical
