

Review
doi: 10.1161/CIRCULATIONAHA.114.010369.
Inflammation and neovascularization intertwined in atherosclerosis: imaging of structural and molecular imaging targets
Affiliations
- PMID: 25156914
- PMCID: PMC4212981
- DOI: 10.1161/CIRCULATIONAHA.114.010369
Item in Clipboard
Review
Inflammation and neovascularization intertwined in atherosclerosis: imaging of structural and molecular imaging targets
Circulation.
.
No abstract available
Keywords: atherosclerosis; imaging, three-dimensional; inflammation; magnetic resonance imaging; neovascularization, physiologic; nuclear medicine; ultrasonography.
Conflict of interest statement
Figures
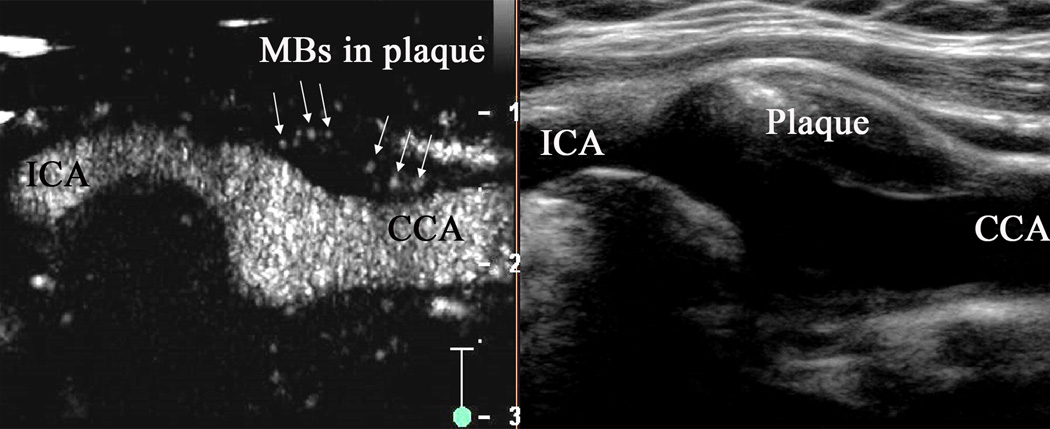
Carotid artery with intraplaque neovascularization on CEUS. Plaque at the origin of the internal carotid artery on B-mode US imaging (right panel). Corresponding artery on contrast-enhanced US (left panel) with visible MBs within the plaque (arrows).
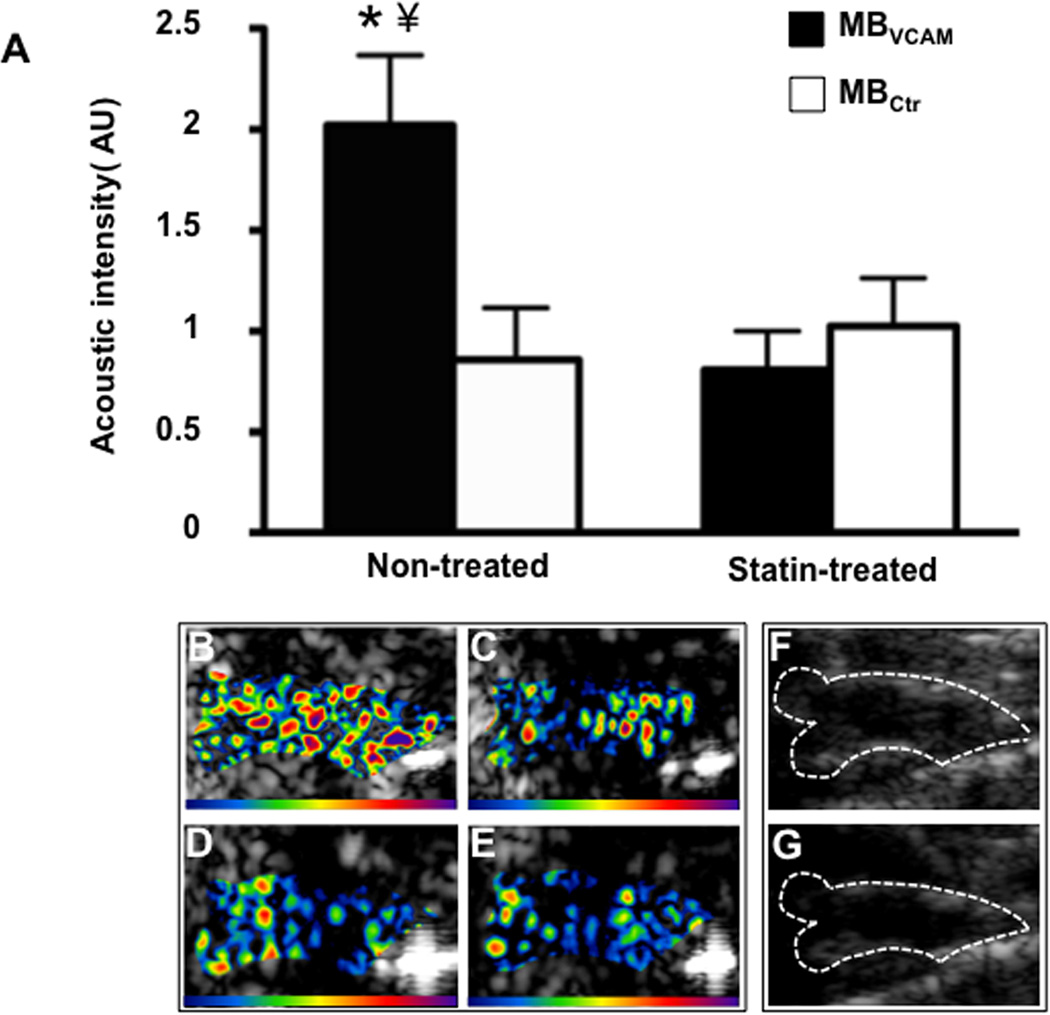
Molecular imaging of the ascending aorta. (A) Mean ± standard error of the mean background-subtracted signal intensity for MBs targeted to VCAM-1 (MBVCAM) and control MBs (MBCtr) in non-treated and statin treated animals. A significant difference in the signal intensity of MBs targeted to VCAM-1 (MBVCAM) was observed compared to control MBs (MBctr), *p<0.01 in non-treated animals, A significant reduced signal intensity of MBVCAM after statin treatment was observed, ¥ p<0.01. Examples of color-coded CEU images from a non-treated animal after injection of MBVCAM (B), and of MBCtr (C). Images from a statin treated animal after injection of MBVCAM (D), and of MBCtr (E). The color scale for the CEU images is shown at the bottom of each frame. A significantly signal difference can be seen in statin treated animal (Figure B versus Figure D). (F) and (G) illustrate the outline of the ascending aorta on B-mode US images which was used as a region of interest for acoustic intensity measurements.
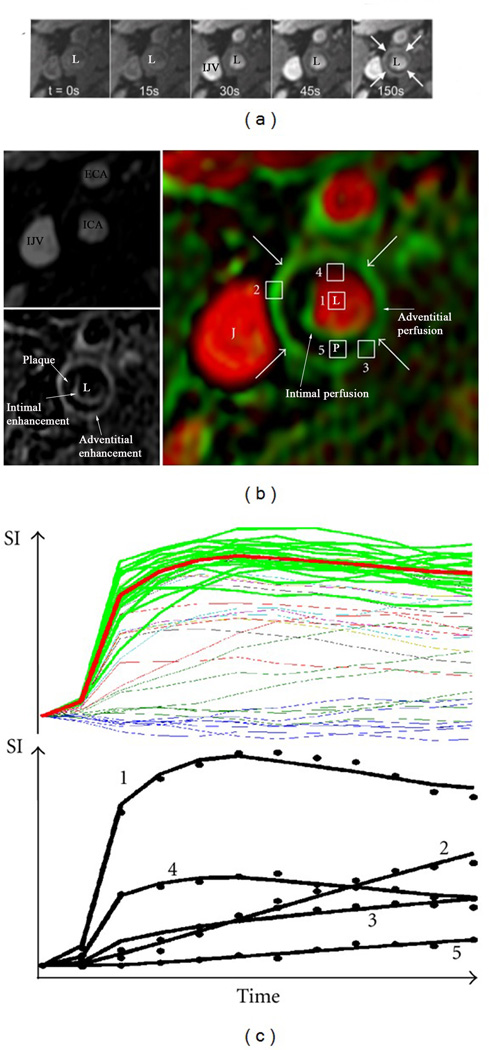
Illustration of vasa vasorum imaging via dynamic contrast-enhanced (DCE) MR imaging. Sequential images after injection of gadolinium contrast agents at different time points (a). L indicates arterial lumen and IJV indicates the internal jugular vein. The sequential images are used in a kinetic model to create parametric images (b) of partial plasma volume (Vp)[top left, ECA: external carotid artery, ICA: internal carotid artery, IJV: internal julgular vein] and transfer constant (Ktrans) (bottom left). These have been fused into the color-coded image at right (arrows indicate adventitia, J: jugular vein, L: lumen, P: plaque). A pixel has been drawn in different sections indicated by numbers i.e. a pixel in the lumen (1), adventitial pixels with high (2) and low (3) Ktrans, a pixel with partial volume of the lumen (4), and an interior plaque pixel (5). Demonstration of intensity vs. time curves for all pixels in the 2cm2 region (all lines) for the set of blood curves extracted by the clustering algorithm (top, green lines) and their average (red line). The bottom curve shows typical fitting results for the kinetic model with corresponding points indicated by numbered pixels shown in (b).
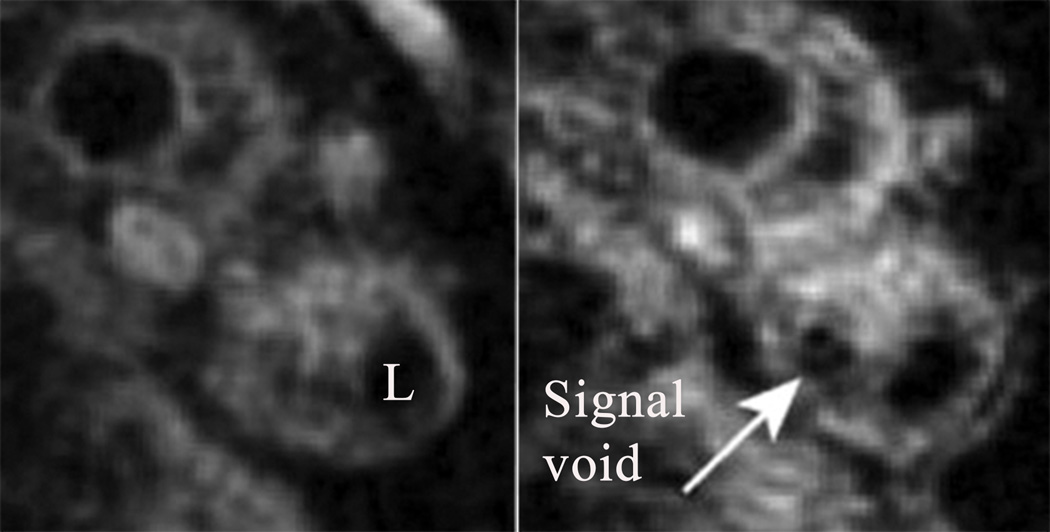
Pre- (A) and post-USPIO (B) MR spiral T2*-weighted axial imaging showing atheromatous plaque in the internal carotid artery of a symptomatic patient. L indicates arterial lumen. Focal USPIO uptake can be seen at 24 hours after intravenous injection as an area of signal drop/void (white arrow).
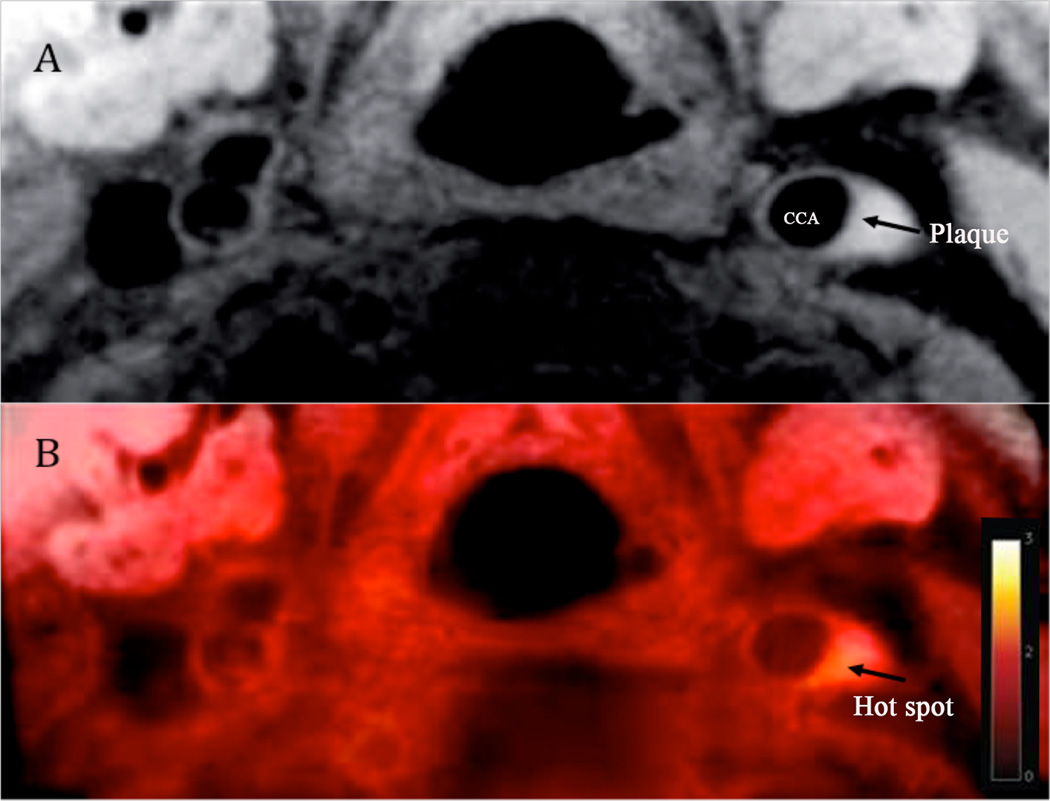
FDG-MR imaging of carotid atheroma in the left common carotid artery. (A) Black-blood MRI, an arrow indicating carotid plaque. (B) Superimposed FDG-MRI showing a hot spot (arrow) due to increased FDG uptake in the area of the carotid plaque.
References
-
- Herrmann J, Lerman LO, Mukhopadhyay D, Napoli C, Lerman A. Angiogenesis in atherogenesis. Arterioscler Thromb Vasc Biol. 2006;26:1948–1957. - PubMed
-
- Staub D, Schinkel AF, Coll B, Coli S, van der Steen AF, Reed JD, Krueger C, Thomenius KE, Adam D, Sijbrands EJ, ten Cate FJ, Feinstein SB. Contrast-enhanced ultrasound imaging of the vasa vasorum: from early atherosclerosis to the identification of unstable plaques. JACC Cardiovasc Imaging. 2010;3:761–771. - PubMed
-
- Shah F, Balan P, Weinberg M, Reddy V, Neems R, Feinstein M, Dainauskas J, Meyer P, Goldin M, Feinstein SB. Contrast-enhanced ultrasound imaging of atherosclerotic carotid plaque neovascularization: a new surrogate marker of atherosclerosis? Vasc Med. 2007;12:291–297. - PubMed
-
- Staub D, Patel MB, Tibrewala A, Ludden D, Johnson M, Espinosa P, Coll B, Jaeger KA, Feinstein SB. Vasa vasorum and plaque neovascularization on contrast-enhanced carotid ultrasound imaging correlates with cardiovascular disease and past cardiovascular events. Stroke. 2010;41:41–47. - PubMed
-
- Deyama J, Nakamura T, Takishima I, Fujioka D, Kawabata K, Obata JE, Watanabe K, Watanabe Y, Saito Y, Mishina H, Kugiyama K. Contrast-enhanced ultrasound imaging of carotid plaque neovascularization is useful for identifying high-risk patients with coronary artery disease. Circ J. 2013;77:1499–1507. - PubMed
Publication types
MeSH terms
Substances
Grants and funding
LinkOut - more resources
Full Text Sources
Other Literature Sources
Medical
