. 2014 Sep 9;111(36):13081-6.
doi: 10.1073/pnas.1401437111. Epub 2014 Aug 25.

Nonlytic viral spread enhanced by autophagy components

Affiliations

Nonlytic viral spread enhanced by autophagy components

Sara Whitney Bird et al. Proc Natl Acad Sci U S A. .

Abstract

The cell-to-cell spread of cytoplasmic constituents such as nonenveloped viruses and aggregated proteins is usually thought to require cell lysis. However, mechanisms of unconventional secretion have been described that bypass the secretory pathway for the extracellular delivery of cytoplasmic molecules. Components of the autophagy pathway, an intracellular recycling process, have been shown to play a role in the unconventional secretion of cytoplasmic signaling proteins. Poliovirus is a lytic virus, although a few examples of apparently nonlytic spread have been documented. Real demonstration of nonlytic spread for poliovirus or any other cytoplasmic constituent thought to exit cells via unconventional secretion requires demonstration that a small amount of cell lysis in the cellular population is not responsible for the release of cytosolic material. Here, we use quantitative time-lapse microscopy to show the spread of infectious cytoplasmic material between cells in the absence of lysis. siRNA-mediated depletion of autophagy protein LC3 reduced nonlytic intercellular viral transfer. Conversely, pharmacological stimulation of the autophagy pathway caused more rapid viral spread in tissue culture and greater pathogenicity in mice. Thus, the unconventional secretion of infectious material in the absence of cell lysis is enabled by components of the autophagy pathway. It is likely that other nonenveloped viruses also use this pathway for nonlytic intercellular spread to affect pathogenesis in infected hosts.

Keywords: live imaging; virus spread.


Conflict of interest statement

The authors declare no conflict of interest.

Figures
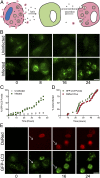
Fig. 1.
Fig. 1.
Live-cell imaging of poliovirus-infected cells. (A) Proposed modes of spread for poliovirus. For most cell lines in tissue culture, lysis occurs 10–12 h after infection. The nonlytic route of viral spread proposed, a form of unconventional secretion, would result in the release of a few virus particles from a living cell, either from intact or ruptured inner compartments of autophagosome-like vesicles induced during infection. Pink cytoplasm indicates infection by PV-DsRed virus. The nucleus in the ruptured infected cell is blue, reflecting the use of the live-dead indicator in the experiments presented. The diffuse green in the uninfected cell represents the cytoplasmic form of GFP-LC3, whereas green puncta indicate the lipidation and membrane localization of GFP-LC3 in infected cells. (B) Single-cell images from Movie S1 of Huh7-A-1/GFP-LC3 cells infected with 2A-144-DsRed poliovirus (PV-DsRed) at a multiplicity of infection (MOI) of 0.1 PFU per cell and imaged every 12 min for 48 h, comparing GFP-LC3 puncta in uninfected (Upper) and infected (Lower). (C) Quantification of time-lapse imaging showing the percentage of cells with GFP-LC3 puncta over 48 h. For each time point, ∼100 cells were scored; data from two replicates are shown. (D) Time course data from one movie showing the percent of infected cells over time. Formation of GFP-LC3 puncta coincided with DsRed expression. (Scale bars: 25 μm.) ****P < 0.0001. (E) Single-cell images of Huh7-A-1/GFP-LC3 cells over 24 h of infection, showing both DsRed expression (Upper) and GFP-LC3 distribution (Lower). Arrows identify individual cells as GFP-LC3 puncta develop and viral infection progresses.
Fig. 2.
Fig. 2.
Stimulation of the autophagy pathway increases the rate of viral spread and pathogenesis. Huh7-A-1/GFP-LC3 cells were infected with PV-DsRed at a MOI of 0.1 PFU per cell and imaged every 12 min for 48 h. Analysis of single-cell images yielded time courses of infection (Right) for untreated cells (A) and for cells treated with either 5 μM loperamide (B) or 5 μM nicardipine (C); see Movies S3, S4, and S5, respectively. (Scale bars: 25 μm.) Mean and SE are shown from three movies for each condition. Statistical significance determined by linear regression analysis comparing slopes of drug-treated to control group. ****P < 0.0001. (D) cPVR mice, which express the human poliovirus receptor in an ICR background, were inoculated intramuscularly with 5 × 10⁶ PFU of Type 1 Mahoney virus. Mice (14 per condition) were treated every 12 h with 25 mg/kg loperamide, or with a control solution, by i.p. injection. LC3 and control proteins from gastrocnemius tissue were displayed by SDS/PAGE and visualized by immunoblotting. Bands for the GAPDH loading control, LC3I and LC3II, the unlipidated and lipidated protein species, are identified. (E) The time of onset of paralysis of cPVR mice was monitored. Statistical significance was determined using the log-rank test. (F) The titers of poliovirus in inoculated calf muscles of cPVR mice were determined 4 d after infection. (G) Viral titers in the inoculated calf muscles of Tg21 mice, which express the poliovirus receptor in a C57BL/6 background and show greater susceptibility to poliovirus growth and pathogenesis than cPVR mice, were determined four days after infection with 3 × 10⁵ PFU of virus. Statistical significance for F and G was determined using Student t test. Bars represent mean and SE.
Fig. 3.
Fig. 3.
Inhibition of LC3 expression reduces spread of poliovirus. (A) Huh7-A-1 cells treated for 48 h with control (luciferase) or LC3 siRNAs were infected with PV-DsRed at a MOI of 0.1 PFU per cell and for 24 h. Representative images of fluorescent, infected cells and the nuclei of all cells, revealed by DAPI staining are shown. (Scale bar: 25 μm.) (B) Numbers of infected cells in 15 randomly chosen plaques from control and LC3 siRNA-treated cells, with and without 5 μM loperamide 36 h postinfection. Statistical significance was determined using Student t test. n = 15. *P < 0.05; **P < 0.01.
Fig. 4.
Fig. 4.
Single-cell analysis of cell viability reveals nonlytic spread of poliovirus infection. Huh7-A-1 cells were inoculated with PV-DsRed at a MOI of 0.1 PFU per cell and imaged every 15 min for 24 h. SYTOX Blue (100 μM) was used to identify dead cells. (A) Single cell images taken from Movie S7 track the onset of the DsRed fluorescence that indicates viral infection (Top), the SYTOX staining that monitors cell death (Middle), and the DIC images that identify all cells and visualize the onset of membrane rupture (Bottom). (Scale bars: 25 μm.) (B) The times of initial signals for DsRed fluorescence, SYTOX fluorescence, or ruffling membranes in the DIC channel are plotted. Means are indicated, and error bars are SEM values. (C) Time difference (Δt) between the onset of DsRed signal in target cell and DIC membrane ruffling signal in donor cell for multiple donor and target pairs. Although mean values are indicated, data points shown as red circles fell outside the 95% range of a normal distribution of Δt using Fisher’s exact test. All such events displayed negative values for Δt. *P < 0.05 for each treatment.

References

    1. Romero-Brey I, et al. Three-dimensional architecture and biogenesis of membrane structures associated with hepatitis C virus replication. PLoS Pathog. 2012;8(12):e1003056. - PMC - PubMed
    1. Cohen JR, Lin LD, Machamer CE. Identification of a Golgi complex-targeting signal in the cytoplasmic tail of the severe acute respiratory syndrome coronavirus envelope protein. J Virol. 2011;85(12):5794–5803. - PMC - PubMed
    1. Votteler J, Sundquist WI. Virus budding and the ESCRT pathway. Cell Host Microbe. 2013;14(3):232–241. - PMC - PubMed
    1. Lloyd RE, Bovee M. Persistent infection of human erythroblastoid cells by poliovirus. Virology. 1993;194(1):200–209. - PubMed
    1. Pelletier I, Duncan G, Colbère-Garapin F. One amino acid change on the capsid surface of poliovirus sabin 1 allows the establishment of persistent infections in HEp-2c cell cultures. Virology. 1998;241(1):1–13. - PubMed

Publication types

Substances