

Ovarian cycle-linked plasticity of δ-GABAA receptor subunits in hippocampal interneurons affects γ oscillations in vivo
- PMID: 25157218
- PMCID: PMC4128222
- DOI: 10.3389/fncel.2014.00222
Ovarian cycle-linked plasticity of δ-GABAA receptor subunits in hippocampal interneurons affects γ oscillations in vivo
Abstract
GABAA receptors containing δ subunits (δ-GABAARs) are GABA-gated ion channels with extra- and perisynaptic localization, strong sensitivity to neurosteroids (NS), and a high degree of plasticity. In selective brain regions they are expressed on specific principal cells and interneurons (INs), and generate a tonic conductance that controls neuronal excitability and oscillations. Plasticity of δ-GABAARs in principal cells has been described during states of altered NS synthesis including acute stress, puberty, ovarian cycle, pregnancy and the postpartum period, with direct consequences on neuronal excitability and network dynamics. The defining network events implicated in cognitive function, memory formation and encoding are γ oscillations (30-120 Hz), a well-timed loop of excitation and inhibition between principal cells and PV-expressing INs (PV + INs). The δ-GABAARs of INs can modify γ oscillations, and a lower expression of δ-GABAARs on INs during pregnancy alters γ frequency recorded in vitro. The ovarian cycle is another physiological event with large fluctuations in NS levels and δ-GABAARs. Stages of the cycle are paralleled by swings in memory performance, cognitive function, and mood in both humans and rodents. Here we show δ-GABAARs changes during the mouse ovarian cycle in hippocampal cell types, with enhanced expression during diestrus in principal cells and specific INs. The plasticity of δ-GABAARs on PV-INs decreases the magnitude of γ oscillations continuously recorded in area CA1 throughout several days in vivo during diestrus and increases it during estrus. Such recurring changes in γ magnitude were not observed in non-cycling wild-type (WT) females, cycling females lacking δ-GABAARs only on PV-INs (PV-Gabrd (-/-)), and in male mice during a time course equivalent to the ovarian cycle. Our findings may explain the impaired memory and cognitive performance experienced by women with premenstrual syndrome (PMS) or premenstrual dysphoric disorder (PMDD).
Keywords: GABAA receptor; PMDD; PMS; delta subunit; gamma oscillations; ovarian cycle; parvalbumin; tonic inhibition.
Figures
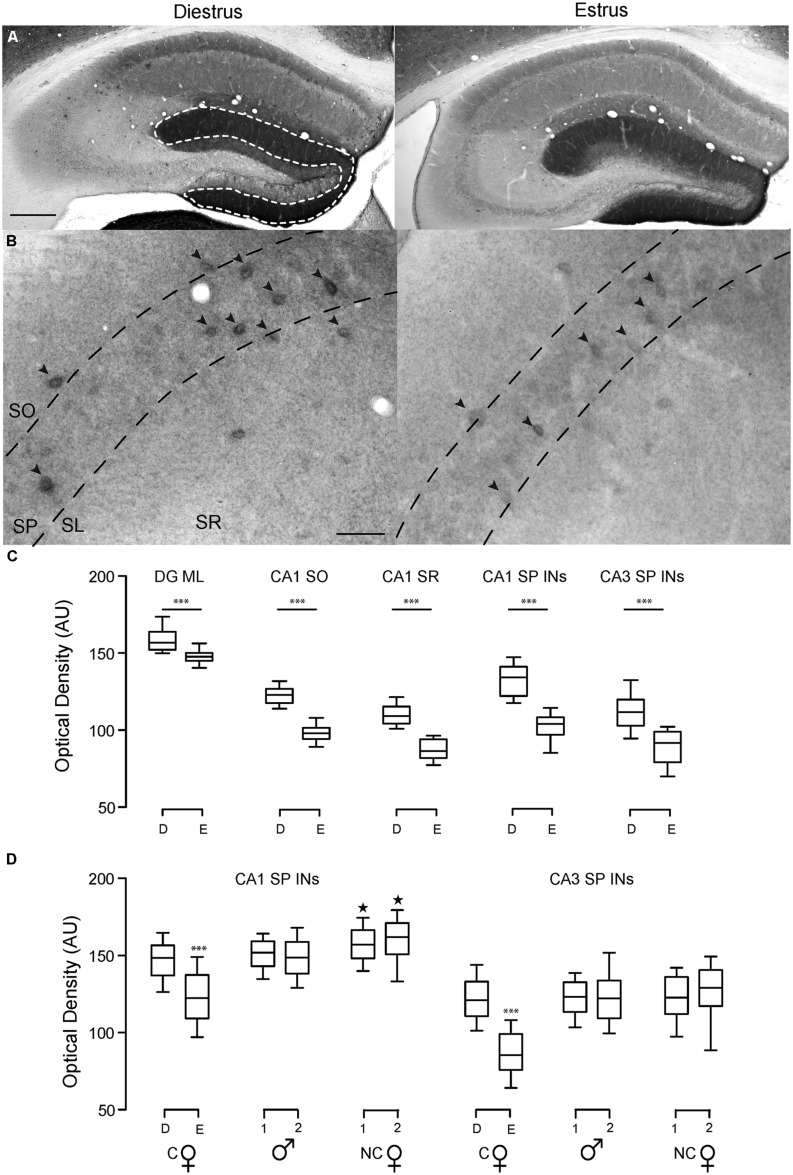
 ) in diestrus (D) or estrus (E), male mice (
 ) and non-cycling WT female mice (NC). δ-GABAARs expression on SP-INs during estrus is lower than any other group in both CA1 and CA3 (***p < 0.0001); in the CA1 the two NC groups are both higher than any other group in CA1 (∗p < 0.0001). Significance levels were established by one-way ANOVA followed by Tukey’s multiple comparisons test. All sections for the separate measurements in (C) and (D) were processed together to allow for densitometric comparisons.
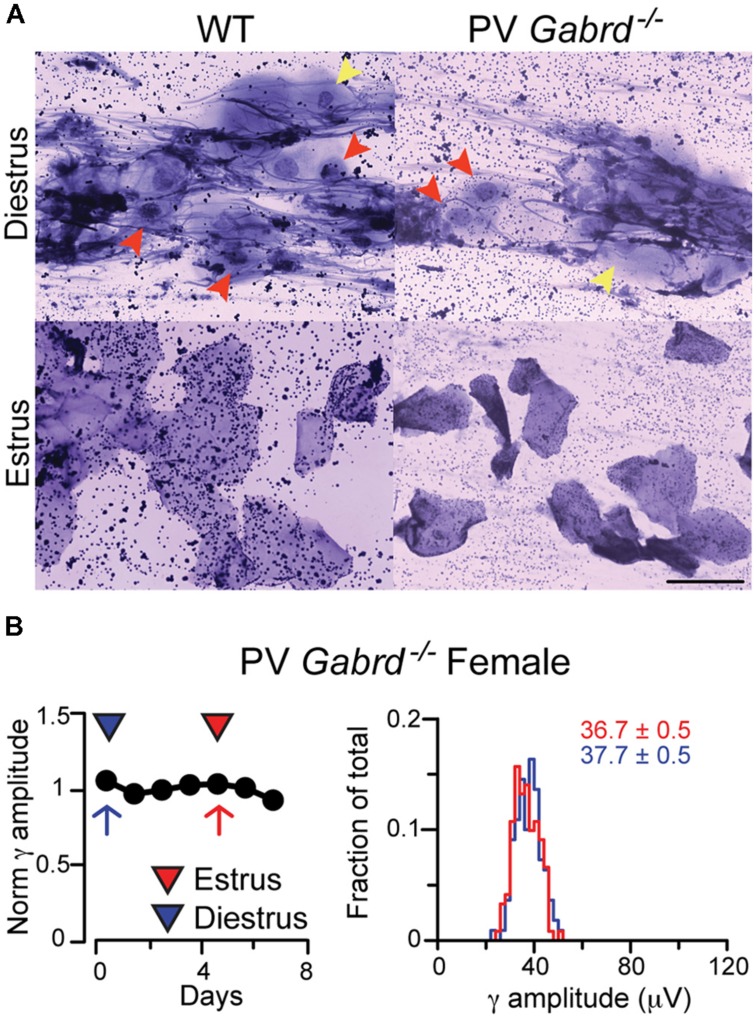
Similar articles
-
In vitro gamma oscillations following partial and complete ablation of δ subunit-containing GABAA receptors from parvalbumin interneurons.Neuropharmacology. 2015 Jan;88:91-8. doi: 10.1016/j.neuropharm.2014.09.010. Epub 2014 Sep 28. Neuropharmacology. 2015. PMID: 25261782 Free PMC article.
-
Altered gamma oscillations during pregnancy through loss of δ subunit-containing GABA(A) receptors on parvalbumin interneurons.Front Neural Circuits. 2013 Sep 17;7:144. doi: 10.3389/fncir.2013.00144. eCollection 2013. Front Neural Circuits. 2013. PMID: 24062647 Free PMC article.
-
Extrasynaptic δ-subunit containing GABAA receptors.J Integr Neurosci. 2021 Mar 30;20(1):173-184. doi: 10.31083/j.jin.2021.01.284. J Integr Neurosci. 2021. PMID: 33834705 Review.
-
Plasticity of GABAA receptors relevant to neurosteroid actions.In: Noebels JL, Avoli M, Rogawski MA, Olsen RW, Delgado-Escueta AV, editors. Jasper's Basic Mechanisms of the Epilepsies [Internet]. 4th edition. Bethesda (MD): National Center for Biotechnology Information (US); 2012. In: Noebels JL, Avoli M, Rogawski MA, Olsen RW, Delgado-Escueta AV, editors. Jasper's Basic Mechanisms of the Epilepsies [Internet]. 4th edition. Bethesda (MD): National Center for Biotechnology Information (US); 2012. PMID: 22787589 Free Books & Documents. Review.
-
The role of ovarian hormone-derived neurosteroids on the regulation of GABAA receptors in affective disorders.Psychopharmacology (Berl). 2014 Sep;231(17):3333-42. doi: 10.1007/s00213-013-3423-z. Epub 2014 Jan 9. Psychopharmacology (Berl). 2014. PMID: 24402140 Free PMC article. Review.
Cited by
-
GABA System Modifications During Periods of Hormonal Flux Across the Female Lifespan.Front Behav Neurosci. 2022 Jun 16;16:802530. doi: 10.3389/fnbeh.2022.802530. eCollection 2022. Front Behav Neurosci. 2022. PMID: 35783228 Free PMC article. Review.
-
Attention-deficit/hyperactivity disorder and the menstrual cycle: Theory and evidence.Horm Behav. 2024 Feb;158:105466. doi: 10.1016/j.yhbeh.2023.105466. Epub 2023 Nov 30. Horm Behav. 2024. PMID: 38039899 Free PMC article. Review.
-
Hormonal regulation of circuit function: sex, systems and depression.Biol Sex Differ. 2019 Feb 28;10(1):12. doi: 10.1186/s13293-019-0226-x. Biol Sex Differ. 2019. PMID: 30819248 Free PMC article. Review.
-
Crosstalk Between GABAergic Neurotransmission and Inflammatory Cascades in the Post-ischemic Brain: Relevance for Stroke Recovery.Front Cell Neurosci. 2022 Mar 23;16:807911. doi: 10.3389/fncel.2022.807911. eCollection 2022. Front Cell Neurosci. 2022. PMID: 35401118 Free PMC article. Review.
-
Effect of estrous cycle on schizophrenia-like behaviors in MAM exposed rats.Behav Brain Res. 2019 Apr 19;362:258-265. doi: 10.1016/j.bbr.2019.01.031. Epub 2019 Jan 17. Behav Brain Res. 2019. PMID: 30660776 Free PMC article.
References
-
- Abramian A. M., Comenencia-Ortiz E., Vithlani M., Tretter E. V., Sieghart W., Davies P. A., et al. (2010). Protein kinase C phosphorylation regulates membrane insertion of GABAA receptor subtypes that mediate tonic inhibition. J. Biol. Chem. 285 41795–41805 10.1074/jbc.M110.149229 - DOI - PMC - PubMed
Grants and funding
LinkOut - more resources
Full Text Sources
Other Literature Sources
Molecular Biology Databases
Miscellaneous