Review
. 2014 Aug 11:8:77.
doi: 10.3389/fnana.2014.00077. eCollection 2014.

Brain scaling in mammalian evolution as a consequence of concerted and mosaic changes in numbers of neurons and average neuronal cell size

Affiliations
Review

Brain scaling in mammalian evolution as a consequence of concerted and mosaic changes in numbers of neurons and average neuronal cell size

Suzana Herculano-Houzel et al. Front Neuroanat. .

Erratum in

Abstract

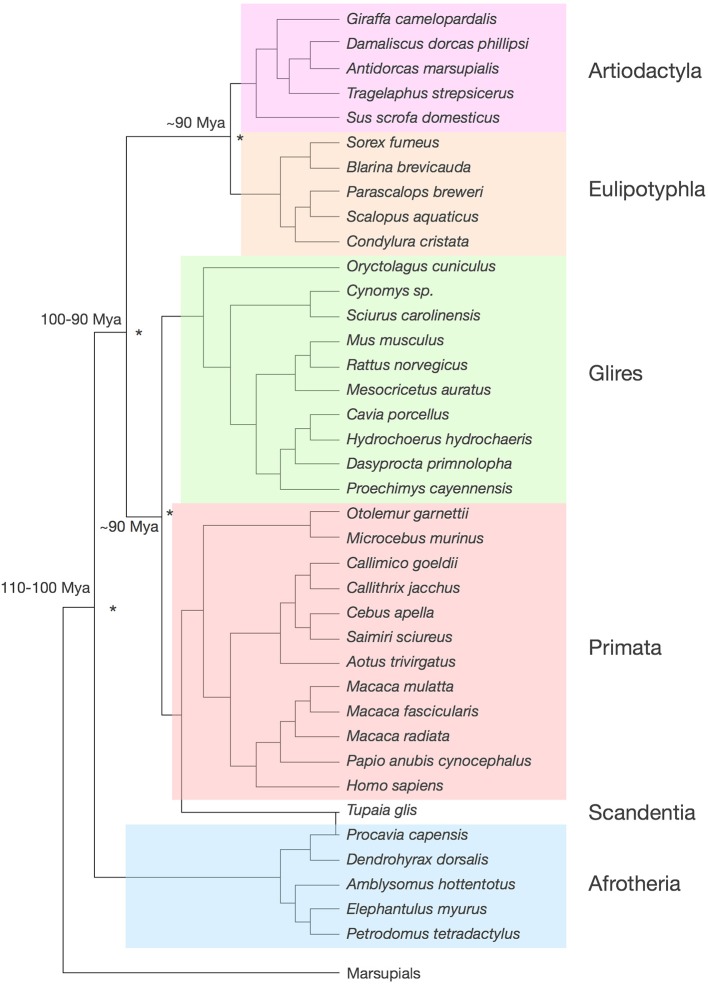
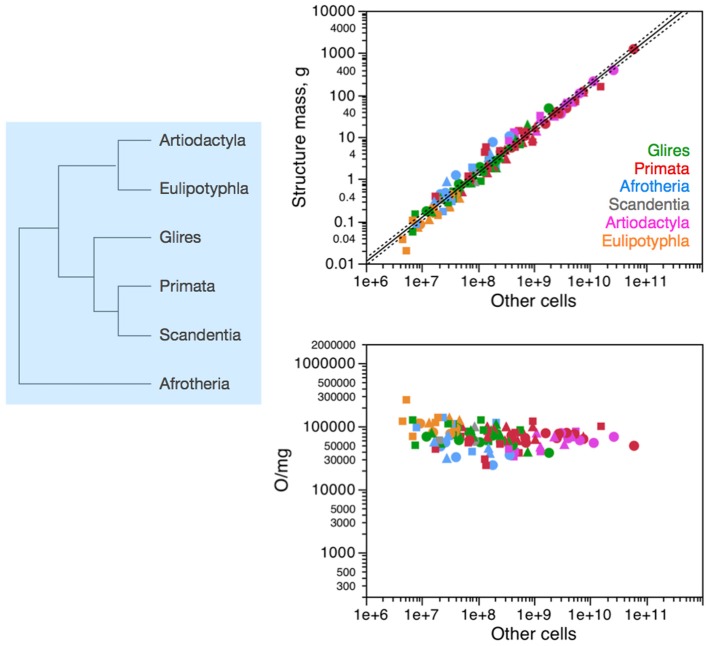
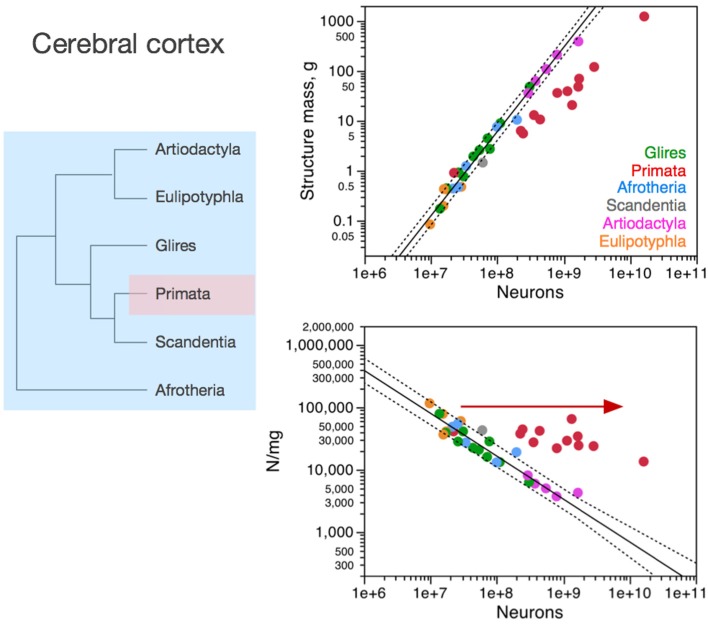
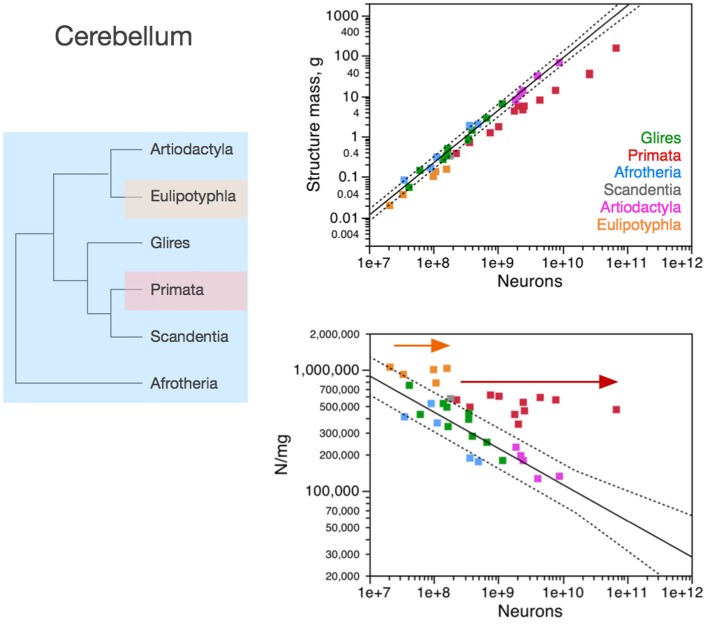
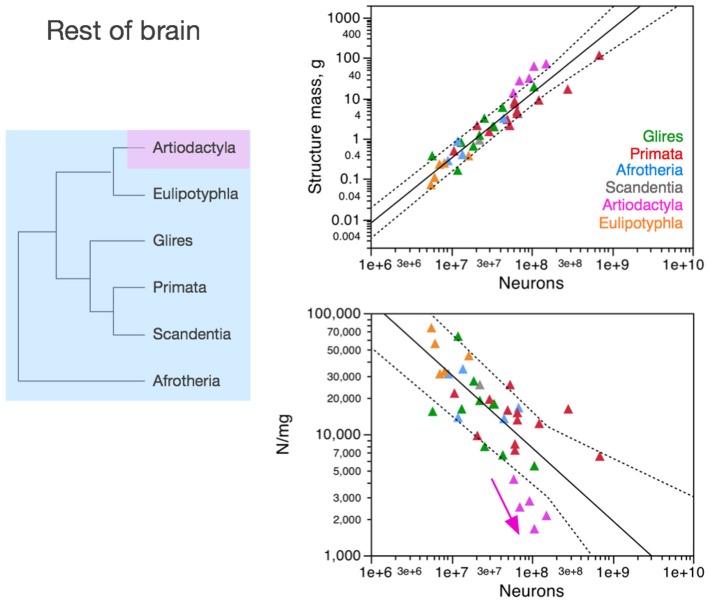
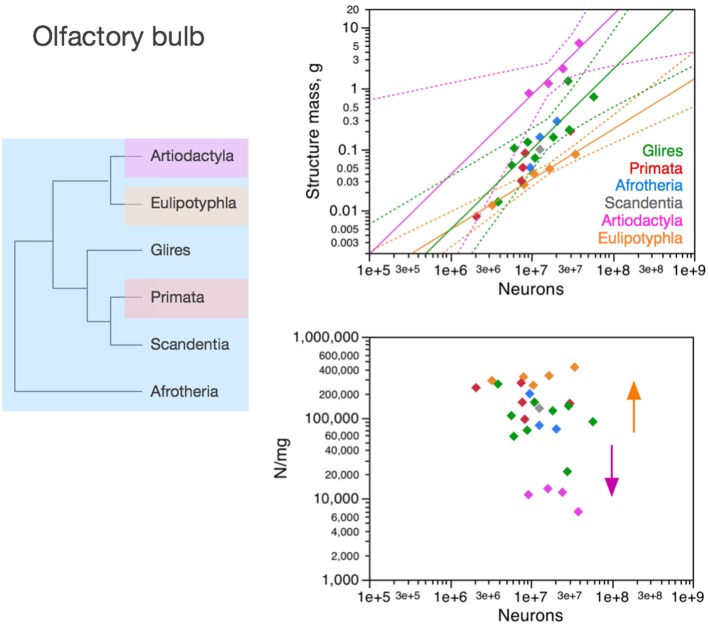
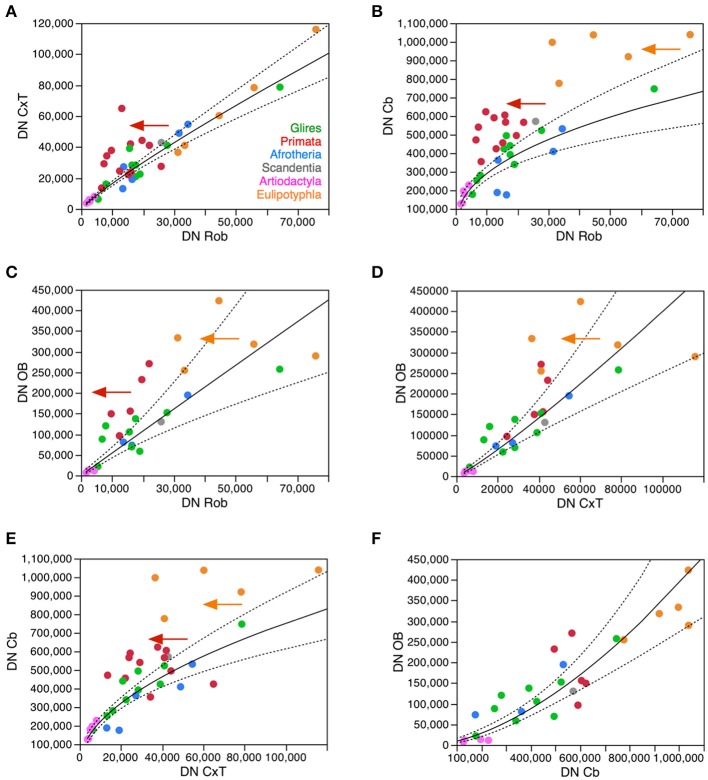
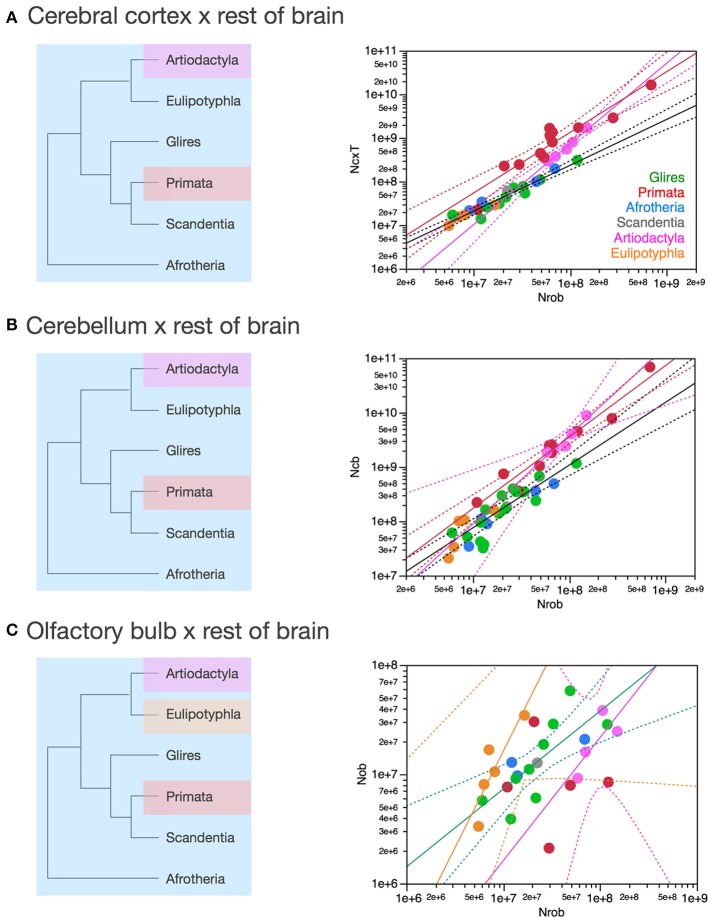
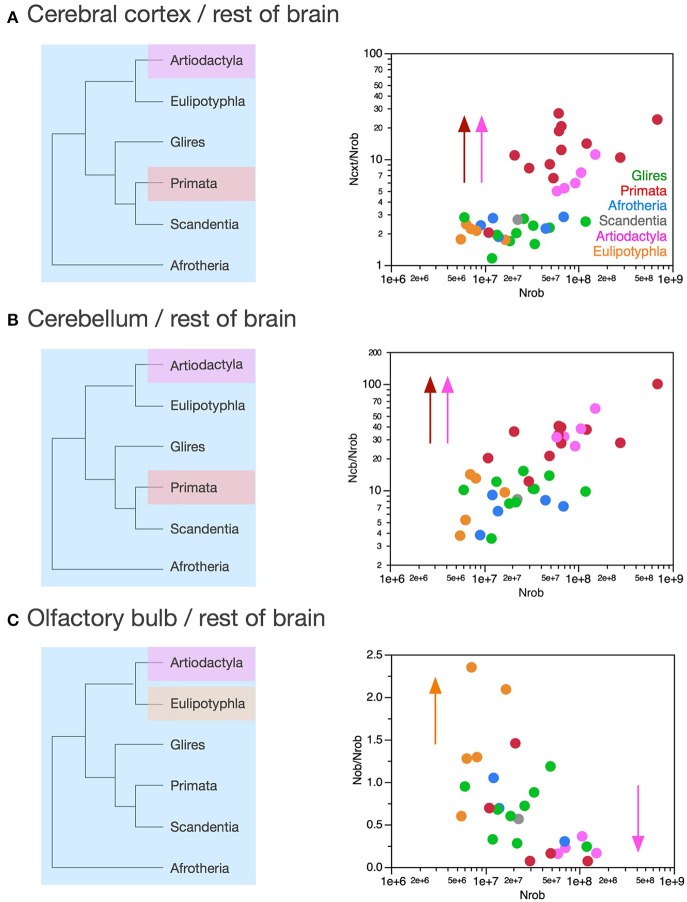
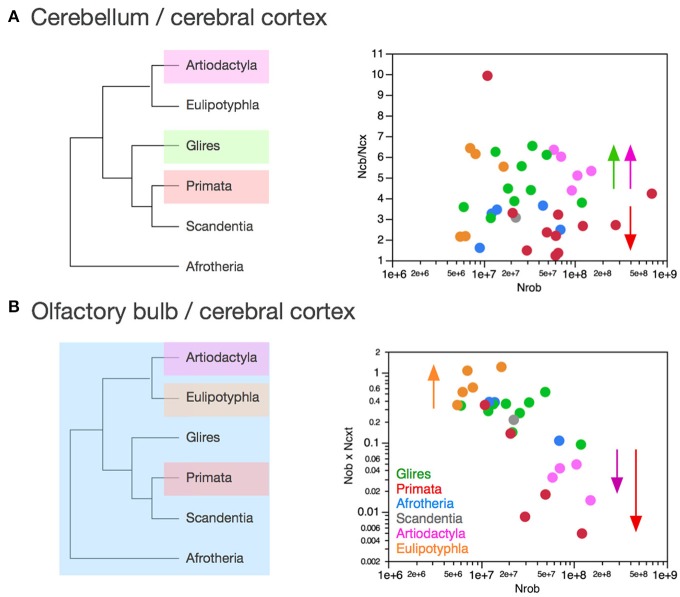
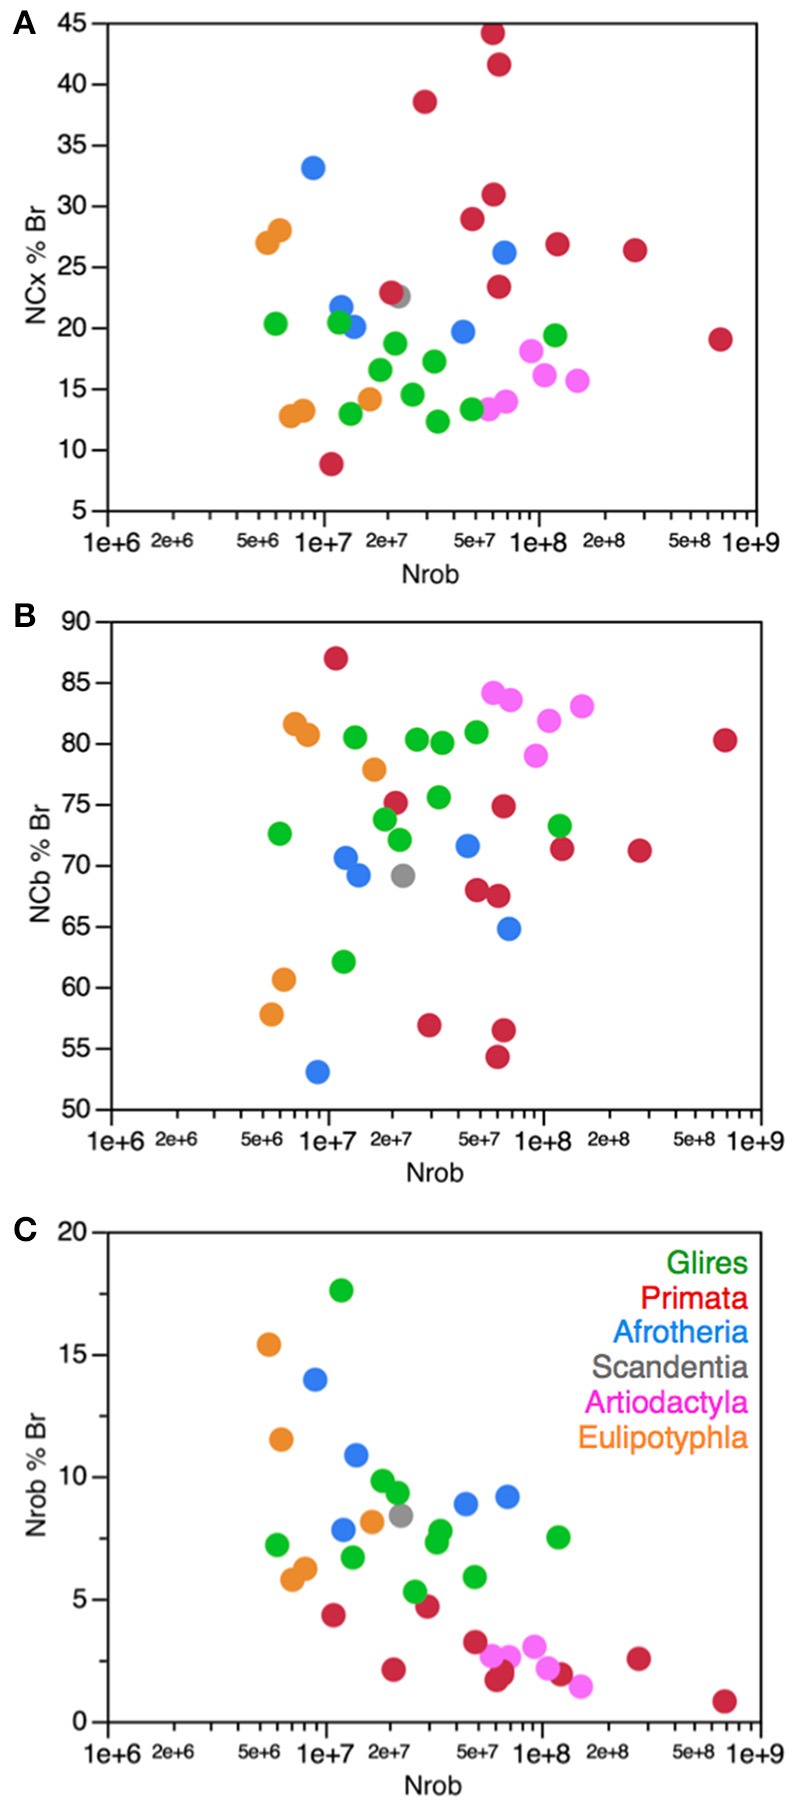
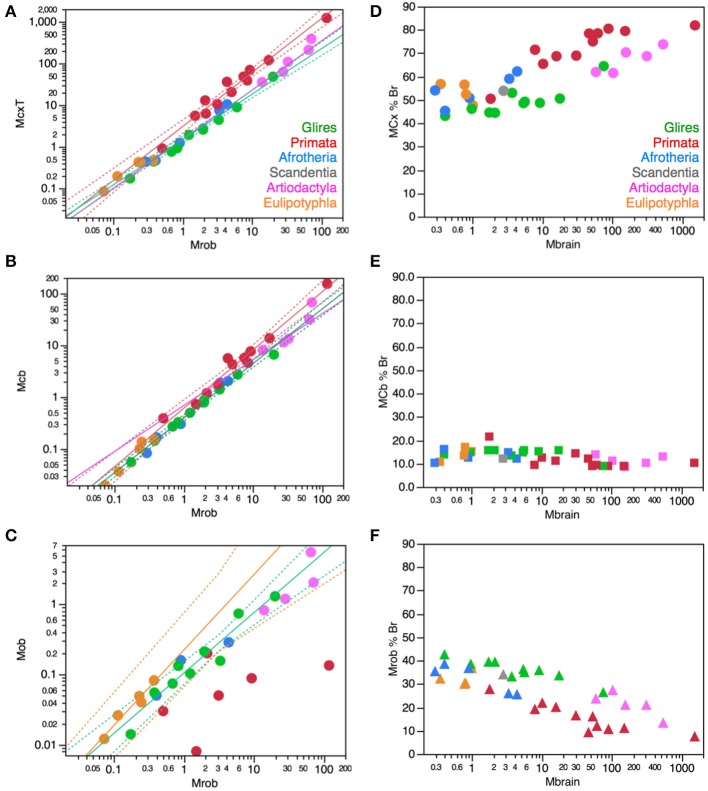
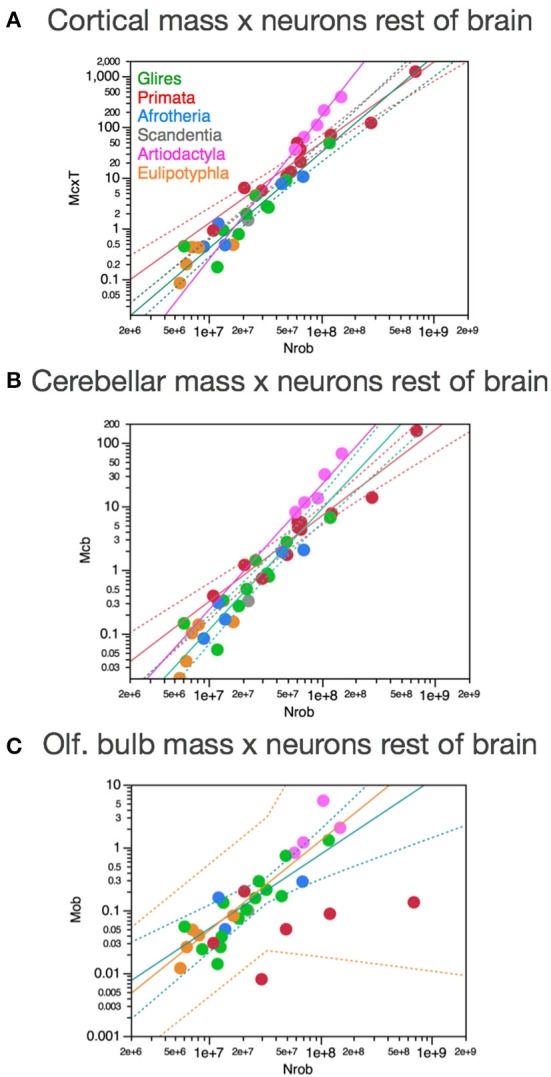
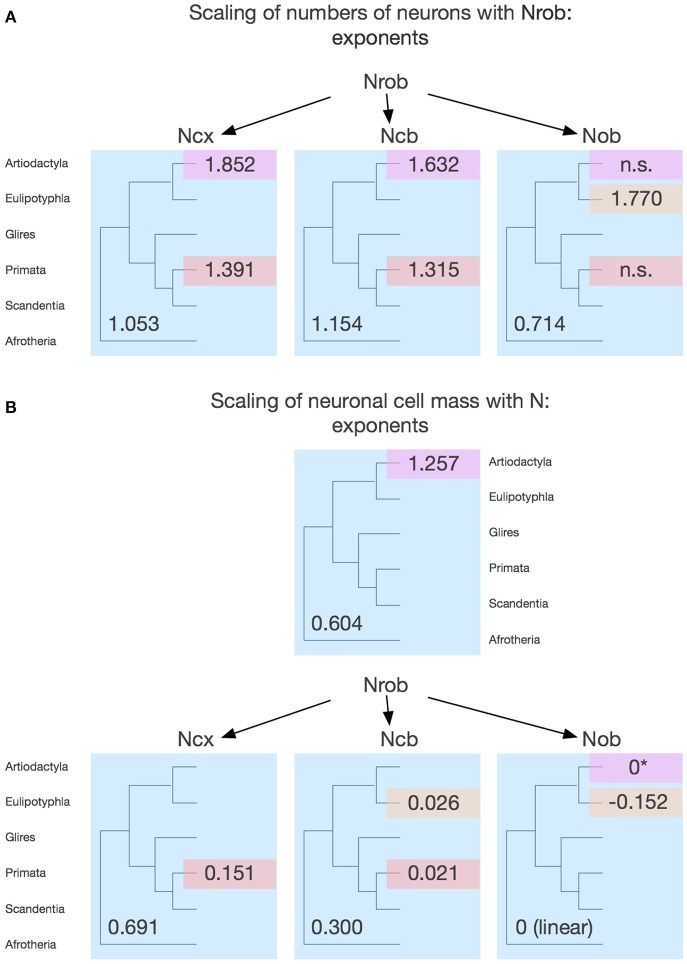
Enough species have now been subject to systematic quantitative analysis of the relationship between the morphology and cellular composition of their brain that patterns begin to emerge and shed light on the evolutionary path that led to mammalian brain diversity. Based on an analysis of the shared and clade-specific characteristics of 41 modern mammalian species in 6 clades, and in light of the phylogenetic relationships among them, here we propose that ancestral mammal brains were composed and scaled in their cellular composition like modern afrotherian and glire brains: with an addition of neurons that is accompanied by a decrease in neuronal density and very little modification in glial cell density, implying a significant increase in average neuronal cell size in larger brains, and the allocation of approximately 2 neurons in the cerebral cortex and 8 neurons in the cerebellum for every neuron allocated to the rest of brain. We also propose that in some clades the scaling of different brain structures has diverged away from the common ancestral layout through clade-specific (or clade-defining) changes in how average neuronal cell mass relates to numbers of neurons in each structure, and how numbers of neurons are differentially allocated to each structure relative to the number of neurons in the rest of brain. Thus, the evolutionary expansion of mammalian brains has involved both concerted and mosaic patterns of scaling across structures. This is, to our knowledge, the first mechanistic model that explains the generation of brains large and small in mammalian evolution, and it opens up new horizons for seeking the cellular pathways and genes involved in brain evolution.

Keywords: brain size; cell size; cortical expansion; evolution; numbers of neurons.


Figures

Figure 1
Figure 1
Phylogenetic relationships among the 41 species analyzed. Tree compiled according to Price et al. (2005); Purvis (1995); Blanga-Kanfi et al. (2009); Douady et al. (2002); Shinohara et al. (2003). The same color code identifying clades is used throughout the figures. Estimated times of divergence across clades (asterisks) are indicated, according to Murphy et al. (2004).
Figure 2
Figure 2
Non-neuronal scaling rules for the different brain structures, that is, the relationship between structure mass and number of non-neuronal (other) cells, is shared across the 41 species in 6 mammalian clades, and thus presumably applied in the evolutionary history of these clades since their common ancestor. Top right: scaling of brain structure mass as a function of numbers of non-neuronal (other) cells in the structure, with a common exponent of 1.020 ± 0.026, p < 0.0001, plotted along with the 95% confidence interval (dashed lines). Bottom right: variation in other (non-neuronal) cell density plotted as a function of numbers of other cells in the structure, showing no significant correlation across the parameters. Each symbol represents the average values for one brain structure (cerebral cortex, circles; cerebellum, squares; rest of brain, triangles) in one species (afrotherians, blue; glires, green; eulipotyphlans, orange; primates, red; scandentia, gray; artiodactyls, pink). The phylogenetic scheme on the left indicates the clades that share the same non-neuronal scaling rules, and the presumed extension of these shared scaling rules to the common ancestor to the 6 clades.
Figure 3
Figure 3
Neuronal scaling rules for the cerebral cortex, that is, the relationship between cortical mass and number of neuronal cells, differs between primates and non-primates, but is shared across all non-primate species examined. Top right: scaling of cerebral cortical mass (gray and white matter combined) as a function of numbers of neurons in the structure across species; Bottom right: scaling of neuronal density as a function of numbers of neurons in the structure. Notice that neuronal density decreases uniformly across species as the cerebral cortex gains neurons, except in primates, which we suggest that branched off the mammalian ancestor (to which the same rules shared by current non-primates applied) when a modification nearly stopped average neuronal cell size from increasing (and thus, neuronal density from decreasing) as the cortex gained neurons (red arrow). Top: primates, function (not plotted for clarity) has exponent 1.087 ± 0.074; all others, joint power function plotted has exponent of 1.688 ± 0.051. Bottom: Primates, exponent −0.150 ± 0.064 (not plotted for clarity); non-primates, exponent −0.688 ± 0.052. Each symbol represents the average values for the cerebral cortex in one species (afrotherians, blue; glires, green; eulipotyphlans, orange; primates, red; scandentia, gray; artiodactyls, pink). The phylogenetic scheme on the left indicates the clades that share the same neuronal scaling rules for the cerebral cortex, and the presumed extension of these shared scaling rules to the common ancestor to the non-primate clades while primates diverge from them.
Figure 4
Figure 4
Neuronal scaling rules for the cerebellum, that is, the relationship between cerebellar mass and number of neuronal cells, differs between primates, eulipotyphlans and other clades, but is shared across the latter. Top right: scaling of cerebellar mass (gray and white matter combined) as a function of numbers of neurons in the structure across species. Non-primates, non-eulipotyphlans, joint exponent of 1.296 ± 0.043, p < 0.0001; primates, exponent of 0.976 ± 0.036, p < 0.0001; eulipotyphlans, exponent of 1.028 ± 0.084, p = 0.0012, not plotted for clarity. Bottom right: scaling of neuronal density as a function of numbers of neurons in the cerebellum. Non-primates, non-eulipotyphlans, joint exponent of −0.299 ± 0.046, p < 0.0001; primates and eulipotyphlans, p = 0.5822 and p = 0.7633, respectively. Notice that neuronal density decreases uniformly across species as the cerebellum gains neurons, except in primates and eulipotyphlans, which we suggest that branched off the mammalian ancestor with a modification that stopped average neuronal cell size in the cerebellum from increasing (and thus, neuronal density from decreasing) as the cerebellum gained neurons (orange and red arrows). Cerebellar neuronal density is higher in eulipotyphlans than in primates, indicating that these two groups do not share neuronal scaling rules for the cerebellum. Each symbol represents the average values for the cerebellum in one species (afrotherians, blue; glires, green; eulipotyphlans, orange; primates, red; scandentia, gray; artiodactyls, pink). The phylogenetic scheme on the left indicates in blue the clades that share the same neuronal scaling rules for the cerebellum, and the presumed extension of these shared scaling rules to the common ancestor to the non-primate, non-eulipotyphlan clades, while primates and eulipotyphlans diverge from them.
Figure 5
Figure 5
Neuronal scaling rules for the rest of brain, that is, the relationship between rest of brain mass and number of neuronal cells, differs between artiodactyls and other clades, but is shared across all non-artiodactyl species examined. Top right: scaling of rest of brain mass as a function of numbers of neurons in the structure across species. Plotted power function applies to all non-artiodactyls, with an exponent of 1.400 ± 0.077, p < 0.0001. Bottom right: scaling of neuronal density in the rest of brain as a function of numbers of neurons in the structure. Plotted power function applies to all non-artiodactyls, with exponent −0.398 ± 0.079, p < 0.0001. Notice that neuronal density decreases uniformly across species as the cerebral cortex gains neurons, but decreases even more steeply in artiodactyls (pink arrow), which we suggest that branched off the mammalian ancestor (to which the same rules shared by current non-artiodactyls applied) when a modification resulted in an even faster increase in average neuronal cell size (and thus, a faster decrease in neuronal density) as the rest of brain gained neurons (pink arrow). Each symbol represents the average values for the rest of brain in one species (afrotherians, blue; glires, green; eulipotyphlans, orange; primates, red; scandentia, gray; artiodactyls, pink). The phylogenetic scheme on the left indicates in blue the clades that share the same neuronal scaling rules for the rest of brain, and the presumed extension of these shared scaling rules to the common ancestor to the non-artiodactyl clades, while artiodactyls diverge from them (pink).
Figure 6
Figure 6
Neuronal scaling rules for the olfactory bulb differ between eulipotyphlans, artiodactyls, primates and other clades. Top right: scaling of olfactory bulb mass as a function of numbers of neurons in the structure across species. Plotted power functions have exponent of 0.823 ± 0.071, p = 0.0014 (eulipotyphlans, orange), 1.309 ± 0.257, p = 0.0364 (artiodactyls, pink), and 1.185 ± 0.186, p < 0.0001 (in green: scandentia, afrotherians and glires, excluding the capybara; Ribeiro et al., 2014). Bottom right: scaling of neuronal density in the olfactory bulb as a function of numbers of neurons in the structure. Power functions are not significant, but neuronal density is highest in eulipotyphlans and lowest in artiodactyls, which we suggest that branched off the mammalian ancestor when modifications resulted in decreased and increased average neuronal cell sizes, respectively (orange and pink arrows). Each symbol represents the average values for the rest of brain in one species (afrotherians, blue; glires, green; eulipotyphlans, orange; primates, red; scandentia, gray; artiodactyls, pink). The phylogenetic scheme on the left indicates in blue the clades that share the same neuronal scaling rules for the olfactory bulb, and the presumed extension of these shared scaling rules to the common ancestor to the non-artiodactyl clades, while artiodactyls and eulipotyphlans diverged from them.
Figure 7
Figure 7
Neuronal density varies concertedly between brain structures across species in most clades, but diverges in others. Plots show how neuronal densities in general vary concertedly across species between the cerebral cortex and rest of brain (A), between the cerebellum and rest of brain (B), between the olfactory bulb and rest of brain (C), between the olfactory bulb and the cerebral cortex (D), between the cerebellum and the cortex (E), and between the olfactory bulb and cerebellum (F). (A) Plotted function excludes primates (red), and has exponent 0.872 ± 0.041 (p < 0.0001). (B) Plotted function excludes primates (red) and eulipotyphlans (orange), with an exponent of 0.446 ± 0.058, p < 0.0001. (C) Plotted function excludes primates (red) and eulipotyphlans (orange), with an exponent of 0.991 ± 0.011, p < 0.0001. (D) Plotted function excludes primates (red) and eulipotyphlans (orange), and has an exponent of 1.133 ± 0.112, p < 0.0001. (E) Plotted function excludes primates (red) and eulipotyphlans (orange), with an exponent of 0.529 ± 0.050, p < 0.0001. (F) Plotted function includes all clades, with an exponent of 1.630 ± 0.166, p < 0.0001. Each symbol represents the average values for the rest of brain in one species (afrotherians, blue; glires, green; eulipotyphlans, orange; primates, red; scandentia, gray; artiodactyls, pink).
Figure 8
Figure 8
Scaling of numbers of neurons in the cerebral cortex, cerebellum and olfactory bulb as a function of numbers of neurons in the rest of brain varies across clades. Each symbol represents the average values for the structures indicated in one species (afrotherians, blue; glires, green; eulipotyphlans, orange; primates, red; scandentia, gray; artiodactyls, pink). The phylogenetic scheme on the left indicates in blue the clades that share the same neuronal scaling rules for the rest of brain, and the presumed extension of these shared scaling rules to the common eutherian ancestor; clades that have divergent scaling rules are colored differently. (A) Scaling of numbers of neurons in the cerebral cortex as a function of numbers of neurons in the rest of brain across species. Power functions plotted have exponents 1.391 ± 0.158, p < 0.0001 (primates, in red), 1.852 ± 0.135, p = 0.0008 (artiodactyls, in pink), and 1.053 ± 0.061, p < 0.0001 (afrotherians, glires, scandentia and eulipotyphlans, in black). (B) Scaling of numbers of neurons in the cerebellum as a function of numbers of neurons in the rest of brain across species. Power functions plotted have exponents 1.315 ± 0.112, p < 0.0001 (primates, in red), 1.632 ± 0.222, p = 0.0148 (artiodactyls, in pink), and 1.154 ± 0.112, p < 0.0001 (afrotherians, glires, scandentia and eulipotyphlans, in black). (C) Scaling of numbers of neurons in the olfactory bulb as a function of numbers of neurons in the rest of brain across species. Power functions plotted have exponents 1.770 ± 0.578, p = 0.0548 (eulipotyphlans, in orange), 1.127 ± 0.638, p = 0.2194 (artiodactyls, in pink), and 0.714 ± 0.181, p = 0.0023 (afrotherians, glires, and scandentia, in black).
Figure 9
Figure 9
Scaling of numbers of neurons in the olfactory bulb as a function of numbers of neurons in the cerebral cortex varies across clades, while numbers of neurons in the cerebellum vary coordinately with numbers of neurons in the cerebral cortex across all clades. Each symbol represents the average values for the structures indicated in one species (afrotherians, blue; glires, green; eulipotyphlans, orange; primates, red; scandentia, gray; artiodactyls, pink). (A) Scaling of numbers of neurons in the olfactory bulb as a function of numbers of neurons in the cerebral cortex across species. Power functions plotted have exponents 2.129 ± 0.428, p = 0.0156 (eulipotyphlans, in orange), and 0.771 ± 0.188, p = 0.0046 (afrotherians, glires and scandentia, in green). The phylogenetic scheme on the left indicates in blue the clades that share the same neuronal scaling rules for the allocation of neurons in the olfactory bulb relative to the cerebral cortex, and the clades that have diverged from the presumed ancestral scaling rules (artiodactyls, eulipotyphlans, and primates). Primates are considered to also diverge from the ancestral scaling rules given their non-conformity to the relationship that applies jointly to afrotherians, glires, and scandentia. (B) Scaling of numbers of neurons in the cerebellum as a function of numbers of neurons in the cerebral cortex across species. The phylogenetic scheme on the left indicates in blue that all clades share similar neuronal scaling rules for the allocation of neurons in the cerebellum relative to the cerebral cortex. Power functions plotted are overlapping and have exponents 0.867 ± 0.108, p < 0.0001 (primates, in red), 0.904 ± 0.110, p = 0.0038 (artiodactyls, in pink), and 1.066 ± 0.111, p < 0.0001 (afrotherians, glires and scandentia, in green). The ensemble of species can be fitted by a linear function of slope 4.12 (p < 0.0001, not plotted).
Figure 10
Figure 10
Variation in the ratios between numbers of neurons in each structure and numbers of neurons in the rest of brain across clades show a relative increase in numbers of neurons in the cerebral cortex and cerebellum in both primates and artiodactyls. Each symbol represents the average values for the structures indicated in one species (afrotherians, blue; glires, green; eulipotyphlans, orange; primates, red; scandentia, gray; artiodactyls, pink). (A) Ratio between numbers of neurons in the cerebral cortex and rest of brain is higher in primates (13.58 ± 2.14, red) and artiodactyls (6.96 ± 1.11, pink) than in afrotherians (2.41 ± 0.18, blue), glires (2.11 ± 0.17, green), eulipotyphlans (2.04 ± 0.13, orange) and scandentia (2.69, gray). The arrows and the phylogenetic scheme on the left indicate the divergence of primates and artiodactyls from the ratio shared by afrotherians, eulipotyphlans, scandentia and glires, and thus presumably also by ancestral mammals. (B) Ratio between numbers of neurons in the cerebellum and rest of brain is also higher in primates (35.91 ± 6.95, red) and artiodactyls (37.34 ± 5.72, pink) than in afrotherians (6.88 ± 0.89, blue), glires (10.03 ± 1.05, green), eulipotyphlans (9.14 ± 2.05, orange) and scandentia (8.24, gray). The arrows and the phylogenetic scheme on the left indicate the divergence of primates and artiodactyls from the ratio shared by afrotherians, eulipotyphlans, scandentia and glires, and thus presumably also by ancestral mammals. (C) ratio between numbers of neurons in the olfactory bulb and rest of brain are larger than 1 only in eulipotyphlans (1.52 ± 0.31, orange), compared to 0.65 ± 0.11 in glires, 0.68 ± 0.22 in afrotherians, 0.49 ± 0.27 in primates, 0.56 in scandentia, and 0.23 ± 0.05 in artiodactyls. The arrows and the phylogenetic scheme on the left indicate the divergence of eulipotyphlans and artiodactyls from the ratio shared by afrotherians, primates, scandentia and glires, and thus presumably also by ancestral mammals.
Figure 11
Figure 11
Clade-specific ratios between numbers of neurons in the olfactory bulb and cerebral cortex, and between numbers of neurons in the cerebellum and cerebral cortex. Each symbol represents the average values for the structures indicated in one species (afrotherians, blue; glires, green; eulipotyphlans, orange; primates, red; scandentia, gray; artiodactyls, pink). (A) Ratio between numbers of neurons in the cerebellum and cerebral cortex is higher in artiodactyls (5.43 ± 0.35), glires (4.76 ± 0.40, green) and eulipotyphlans (4.48 ± 0.96, orange) than in afrotherians (2.89 ± 0.38, blue), primates (3.15 ± 0.73) and scandentia (3.07, gray). The arrows indicate the differences cross clades, although the absence of clearly shared rates between at least afrotherians and glires precludes inferring the ratios that applied to ancestral mammals. (B) Ratio between numbers of neurons in the olfactory bulb and cerebral cortex is much higher in eulipotyphlans (0.75 ± 0.16, orange) than in all other clades (afrotherians, 0.29 ± 0.09; glires, 0.30 ± 0.04; scandentia, 0.21) and particularly low in artiodactyls (0.03 ± 0.01, pink). The arrows and the phylogenetic scheme on the left indicate the divergence of primates and artiodactyls from the ratio shared by afrotherians, eulipotyphlans, scandentia and glires, and thus presumably also by ancestral mammals.
Figure 12
Figure 12
No systematic variation in relative number of brain neurons in the cerebral cortex and cerebellum with variations in the number of neurons in the rest of brain. Each symbol represents the average values for the structures indicated in one species (afrotherians, blue; glires, green; eulipotyphlans, orange; primates, red; scandentia, gray; artiodactyls, pink). (A) The percentage of brain neurons found in the cerebral cortex in each species does not vary in correlation with the number of neurons in the rest of brain (Spearman correlation, p = 0.5242). (B) The percentage of brain neurons found in the cerebellum in each species also does not vary in correlation with the number of neurons in the rest of brain (Spearman correlation, p = 0.3838). (C) The percentage of neurons in the rest of brain, however, decreases significantly with increasing number of neurons in the rest of brain (Spearman correlation, ρ = −0.665, p < 0.0001).
Figure 13
Figure 13
Absolute and relative mass relationships across brain structures. Each symbol represents the average values for the structures indicated in one species (afrotherians, blue; glires, green; eulipotyphlans, orange; primates, red; scandentia, gray; artiodactyls, pink). (A) the mass of the cerebral cortex increases more rapidly with increasing rest of brain mass across primates (exponent, 1.294 ± 0.069, p < 0.0001; red) than across all other clades (exponent, 1.136 ± 0.025, p < 0.0001; green). (B) The mass of the cerebellum also increases more rapidly with increasing rest of brain mass across primates (exponent, 1.123 ± 0.067, p < 0.0001; red) than across all other clades (exponent, 1.046 ± 0.019, p < 0.0001; green). (C) the mass of the olfactory bulb increases similarly across non-primate clades with increasing rest of brain mass (exponent, 0.808 ± 0.041, p < 0.0001; green), in a relationship that excludes primates, but the exponent for eulipotyphlans is significantly higher (1.076 ± 0.137, p = 0.0043; orange). (D) The percentage of brain mass found in the cerebral cortex varies across all species in correlation with total brain mass (Spearman correlation, ρ = 0.7551, p < 0.0001), and primates have a relatively larger cerebral cortex than other mammals of similar brain mass. (E) The percentage of brain mass found in the cerebellum varies across all species in negative correlation with total brain mass (Spearman correlation, ρ = −0.4948, p = 0.0019). (F) The percentage of brain mass found in the rest of brain decreases with increasing brain mass across all species (Spearman correlation, ρ = −0.7807, p < 0.0001), and is smaller in primates than in glires and artiodactyls of similar brain mass.
Figure 14
Figure 14
Scaling of brain structure mass as a function of numbers of neurons in the rest of brain. Each symbol represents the average values for the structures indicated in one species (afrotherians, blue; glires, green; eulipotyphlans, orange; primates, red; scandentia, gray; artiodactyls, pink). (A) The cerebral cortex gains mass much faster in artiodactyls than in other clades as a function of numbers of neurons in the rest of brain across species. Power functions plotted have exponents 2.826 ± 0.302, p < 0.0001 (artiodactyls, in pink), 1.588 ± 0.134, p < 0.0001 (primates, in red), and 1.743 ± 0.147, p = 0.0112 (afrotherians, glires, scandentia and eulipotyphlans, in green). (B) The artiodactyl cerebellum also gains mass much faster than the cerebellum in other clades as a function of numbers of neurons in the rest of brain across species. Power functions plotted have exponents 1.976 ± 0.648, p = 0.0929 (artiodactyls, in pink), 1.351 ± 0.126, p < 0.0001 (primates, in red), and 1.665 ± 0.147, p < 0.0001 (afrotherians, glires, scandentia and eulipotyphlans, in green). (C) Scaling of olfactory bulb mass as a function of numbers of neurons in the rest of brain with similar exponents of 1.449 ± 0.524 in eulipotyphlans (p = 0.0720) and 1.183 ± 0.249 (p = 0.0006) in afrotherians, glires and scandentia, while primates fall outside the 95% confidence interval for the latter.
Figure 15
Figure 15
Schematic of the proposed conserved and mosaic evolution of mammalian brain scaling. (A) Scaling of numbers of neurons in the different brain structures as the rest of brain gains neurons. The three panels show the phylogenetic trees indicating in blue what we propose to be the scaling exponents that applied to ancestral mammals determining the rate at which each structure gains neurons as the rest of brain also gains neurons, and that still apply to some modern clades. The different colors show the clade-specific changes in the respective exponents. n.s., exponent is non-significant. Notice that both artiodactyls and primates exhibit a change in rate over the ancestral scaling that is however coordinated across cerebral cortex and cerebellum. (B) Scaling of estimated average neuronal cell mass in the different brain structures as each structure gains neurons. The four panels show the phylogenetic trees indicating in blue what we propose to be the scaling exponents that applied to ancestral mammals determining the rate at which neurons in each structure increase in size (mass) as the structure gains neurons, that still apply to some modern clades, and in different colors the exponents that apply to divergent clades. The asterisk for the artiodactyl olfactory bulb indicates that although there is still no significant scaling in the structure, as in the putative ancestral scaling rules, average neuronal cell mass is inferred to have undergone a step increase relative to the ancestral condition.

References

    1. Azevedo F. A. C., Carvalho L. R. B., Grinberg L. T., Farfel J. M., Ferretti R. E. L., Leite R. E. P., et al. (2009). Equal numbers of neuronal and non-neuronal cells make the human brain an isometrically scaled-up primate brain. J. Comp. Neurol. 513, 532–541 10.1002/cne.21974 - DOI - PubMed
    1. Bahney J., von Bartheld C. S. (2014). Validation of the isotropic fractionator: comparison with unbiased stereology and DNA extraction for quantification of glial cells. J. Neurosci. Meth. 222, 165–174 10.1016/j.jneumeth.2013.11.002 - DOI - PMC - PubMed
    1. Balsters J. H., Cussans E., Diedrichsen J., Phillips K. A., Preuss T. M., Rilling J. K., et al. (2010). Evolution of the cerebellar cortex: the selective expansion of prefrontal-projecting cerebellar lobules. Neuroimage 49, 2045–2052 10.1016/j.neuroimage.2009.10.045 - DOI - PMC - PubMed
    1. Barton R. A., Harvey P. H. (2000). Mosaic evolution of brain structure in mammals. Nature 405, 1055–1058 10.1038/35016580 - DOI - PubMed
    1. Benavides-Piccione R., Hamzei-Sichani F., Ballesteros-Yáñez I., DeFelipe J., Yuste R. (2006). Dendritic size of pyramidal neurons differs among mouse cortical regions. Cereb. Cortex 16, 990–1001 10.1093/cercor/bhj041 - DOI - PubMed

LinkOut - more resources