

Genetic interactions matter more in less-optimal environments: a Focused Review of "Phenotype uniformity in combined-stress environments has a different genetic architecture than in single-stress treatments" (Makumburage and Stapleton, 2011)
- PMID: 25157259
- PMCID: PMC4127526
- DOI: 10.3389/fpls.2014.00384
Genetic interactions matter more in less-optimal environments: a Focused Review of "Phenotype uniformity in combined-stress environments has a different genetic architecture than in single-stress treatments" (Makumburage and Stapleton, 2011)
Abstract
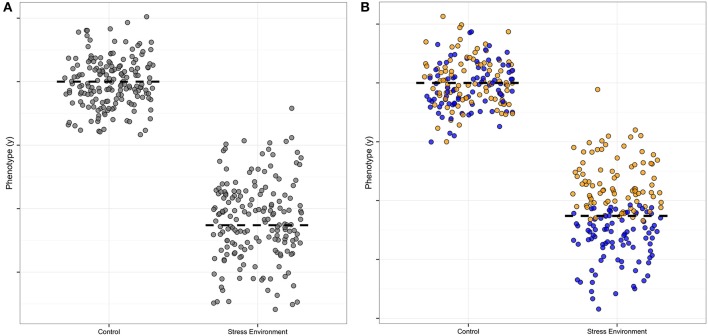
An increase in the distribution of data points indicates the presence of genetic or environmental modifiers. Mapping of the genetic control of the spread of points, the uniformity, allows us to allocate genetic difference in point distribution to adjacent, cis effects or to independently segregating, trans genetic effects. Our genetic architecture-mapping experiment elucidated the "environmental context specificity" of modifiers, the number and effect size of positive and negative alleles important for uniformity in single and combined stress, and the extent of additivity in estimated allele effects in combined stress environments. We found no alleles for low uniformity in combined stress treatments in the maize mapping population we examined. The major advances in this research area since early 2011 have been in improved methods for modeling of distributions and means and detection of important loci. Double hierarchical general linear models and, more recently, a likelihood ratio formulation have been developed to better model and estimate the genetic and environmental effects in populations. These new methods have been applied to real data sets by the method authors and we now encourage additional development of the software and wider application of the methods. We also propose that simulations of genetic regulatory network models to examine differences in uniformity and systematic exploration of models using shared simulations across communities of researchers would be constructive avenues for developing further insight into the genetic mechanisms of variation control.
Keywords: QTL; abiotic stress; combined stress effects; crop; genotype-environment interaction; modifier; uniformity; variance heterogeneity.
Figures
References
-
- Cairns J. E., Crossa J., Zaidi P. H., Grudloyma P., Sanchez C., Araus J. L., et al. (2013). Identification of drought, heat, and combined drought and heat tolerant donors in Maize. Crop Sci. 53, 1335 10.2135/cropsci2012.09.0545 - DOI
-
- Cleasby I. R., Nakagawa S. (2011). Neglected biological patterns in the residuals. Behav. Ecol. Sociobiol. 65, 2361–2372 10.1007/s00265-011-1254-7 - DOI
Publication types
LinkOut - more resources
Full Text Sources
Other Literature Sources