. 2014 Aug 13;4(10):1039-51.
doi: 10.7150/thno.7866. eCollection 2014.

Megalin-mediated specific uptake of chitosan/siRNA nanoparticles in mouse kidney proximal tubule epithelial cells enables AQP1 gene silencing

Affiliations

Megalin-mediated specific uptake of chitosan/siRNA nanoparticles in mouse kidney proximal tubule epithelial cells enables AQP1 gene silencing

Shan Gao et al. Theranostics. .

Abstract

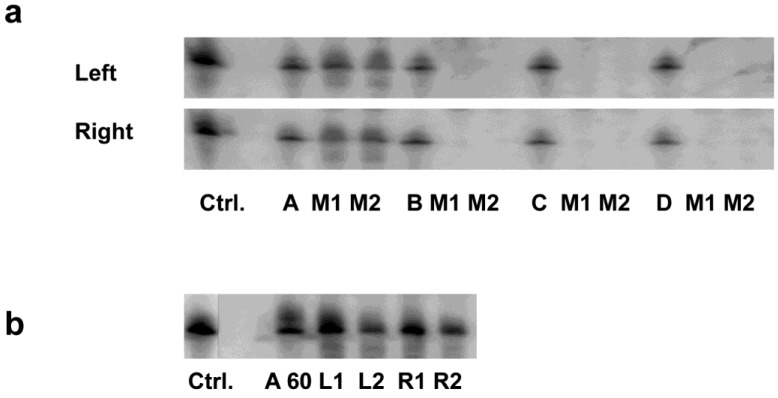
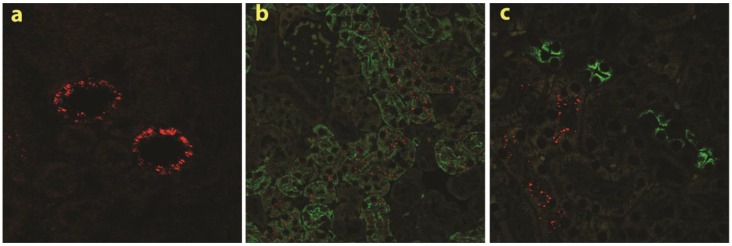
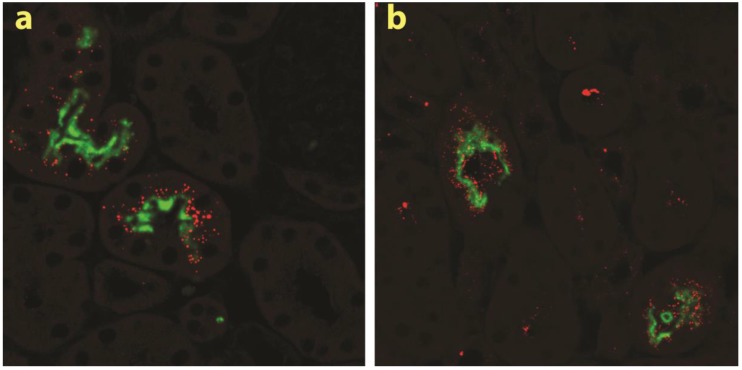
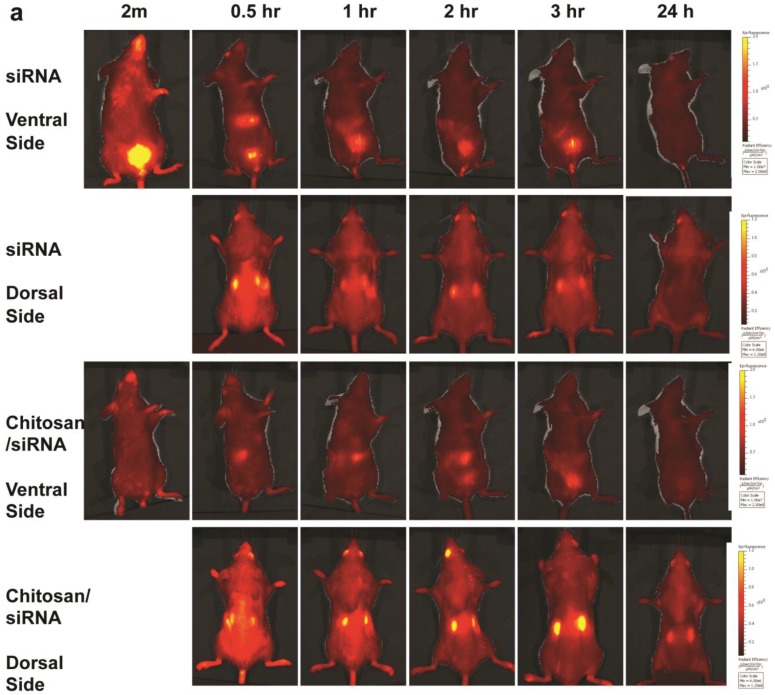
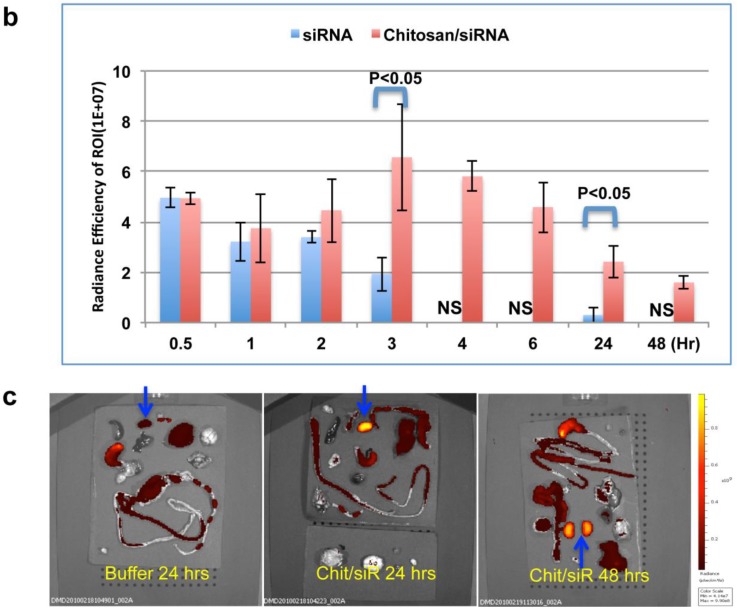
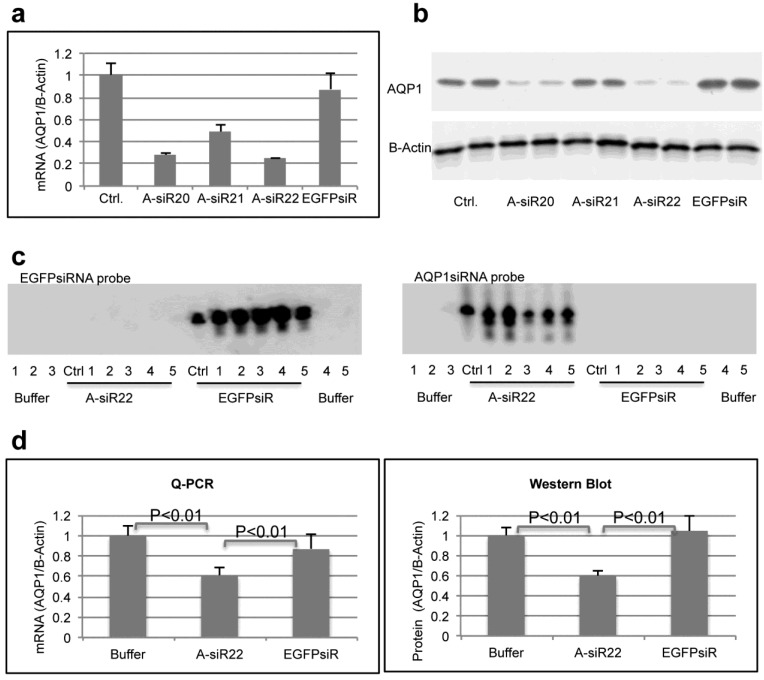
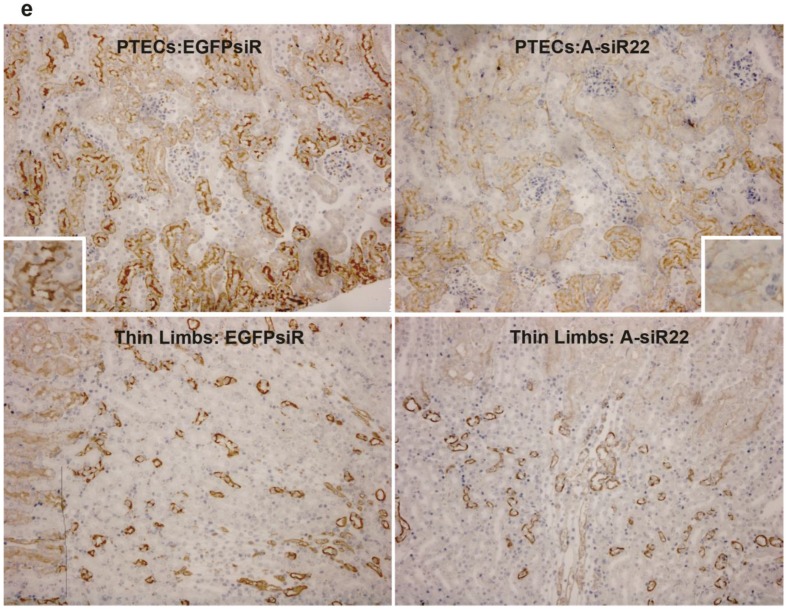
RNAi-based strategies provide a great therapeutic potential for treatment of various human diseases including kidney disorders, but face the challenge of in vivo delivery and specific targeting. The chitosan delivery system has previously been shown to target siRNA specifically to the kidneys in mice when administered intravenously. Here we confirm by 2D and 3D bioimaging that chitosan formulated siRNA is retained in the kidney for more than 48 hours where it accumulates in proximal tubule epithelial cells (PTECs), a process that was strongly dependent on the molecular weight of chitosan. Chitosan/siRNA nanoparticles, administered to chimeric mice with conditional knockout of the megalin gene, distributed almost exclusively in cells that expressed megalin, implying that the chitosan/siRNA particle uptake was mediated by a megalin-dependent endocytotic pathway. Knockdown of the water channel aquaporin 1 (AQP1) by up to 50% in PTECs was achieved utilizing the systemic i.v. delivery of chitosan/AQP1 siRNA in mice. In conclusion, specific targeting PTECs with the chitosan nanoparticle system may prove to be a useful strategy for knockdown of specific genes in PTECs, and provides a potential therapeutic strategy for treating various kidney diseases.

Keywords: aquaporin 1; chitosan; megalin; optical imaging.; renal targeting; siRNA.


Conflict of interest statement

Competing Interests: NO conflict of interest to disclose.

Figures

Figure 1
Figure 1
Impact of molecular weight of chitosan on siRNA delivery to the kidney: (a). Delivery using chitosan with various molecular weights. siRNA formulated with chitosan of different molecular weights (N/P=10) were i.v. injected in mice. Kidneys were collected 24 hrs post injection. Four micrograms of RNA isolated from cortex of left and right kidneys was run on 15% denaturing polyacrylamide gels and northern analysis was performed using [γ-32P] ATP labelled siRNA sense strand. Lane 1, 1 ng siRNA duplexes (Ctrl.); Lanes 2-4/5-7/8-10/11-13, 1 ng siRNA/chitosan complex (N/P=10) (Chitosan A, B, C, D, respectively), experiments were performed in groups of two mice (M1, M2) for each formulation. (b). Delivery using chitosan A/siRNA (N/P= 60). siRNA formulated with chitosan A/siRNA (N/P= 60) was injected i.v. in mice (n=2) and kidneys were collected 24 hrs post injection. RNA was obtained from cortex and northern analysis was performed as described above. Lane 1, 1 ng siRNA duplexes (Ctrl.); Lane 2, 1 ng chitosan A/siRNA; Lanes 3-6, RNA from left (L1 and L2) and right kidney (R1 and R2) from mouse 1 (L1 and R1) and mouse 2 (L2 and R2), respectively.
Figure 2
Figure 2
Specific accumulation of chitosan A/siRNA nanoparticles in kidney PTECs: The kidneys were collected at 24 hrs post-injection from the mice injected with polyplexes formulated with Cy3-siRNA and chitosan A (N/P=60). Sections were made and analysed by fluorescence microscopy, Cy3 signal (red dots) was observed in the kidney (a); the neighbouring sections from the same experiment were labelled with specific antibodies against AQP1 and AQP2 (both in green), clearly demonstrated that chitosan/Cy3-siRNA is co-localised with AQP1 at proximal tubular cells (b), but not with AQP2 in collecting duct cells (c).
Figure 3
Figure 3
Megalin-mediated endocytotic uptake of chitosan/siRNA nanoparticles in PTECs: Chitosan/Cy3-siRNA and Cy3-chitosan/siRNA polyplexes were injected via tail vein into a mouse model with conditional deletion of the megalin gene and the kidneys were collected after 24 hrs (n=3). Serial sections were labelled with specific antibodies against megalin. Both chitosan/Cy3-siRNA (a) and Cy3-chitosan/siRNA (b) signals co-localized with megalin expressing cells.
Figure 4
Figure 4
Dynamic observation of chitosan/siRNA polyplexes in the kidney using in vivo optical imaging: Whole animal fluorescence scanning was performed at the indicated time points post-injection of chitosan/Cy5 labelled siRNA. (a) Representative images of mice injected with siRNA alone or chitosan/siRNA nanoparticles at 2 min, 0.5hr, 1hr, 2hr, 3 hr, and 24 hr. Scanning was performed either from the ventral side (panel 1 & 3) showing the signals at mouth/nose, liver, and bladder or dorsal side (panel 2 & 4), showing signals from paws, ears, and kidney. (b), To quantify the signal intensity of images, the average radiant efficiency [(photons/sec/cm2/sr)/(µW/cm2)] was measured using the Living Image 4.0 software package. Radiant efficiency from the region of interest (ROI) (kidney) in mice injected with siRNA (n=3) and chitosan/siRNA (n=4) at the indicated time points is presented (NS - not scanned at this time point for siRNA injected mice). Significant difference for the fluorescent intensity was seen between the two groups at 3 hrs and 24 hrs (p<0.05 evaluated by Student t-test). (c) Ex vivo imaging of dissected organs 24 or 48 hrs after administration of chitosan/siRNA nanoparticle or buffer (only at 24 hrs), including kidneys (arrows), stomach, liver, intestine/colon, spleen, lung, and heart. Strong Cy5 signal was only observed in the kidney except a prominent auto-fluorescence signal originated from feed in the stomach.
Figure 4
Figure 4
Dynamic observation of chitosan/siRNA polyplexes in the kidney using in vivo optical imaging: Whole animal fluorescence scanning was performed at the indicated time points post-injection of chitosan/Cy5 labelled siRNA. (a) Representative images of mice injected with siRNA alone or chitosan/siRNA nanoparticles at 2 min, 0.5hr, 1hr, 2hr, 3 hr, and 24 hr. Scanning was performed either from the ventral side (panel 1 & 3) showing the signals at mouth/nose, liver, and bladder or dorsal side (panel 2 & 4), showing signals from paws, ears, and kidney. (b), To quantify the signal intensity of images, the average radiant efficiency [(photons/sec/cm2/sr)/(µW/cm2)] was measured using the Living Image 4.0 software package. Radiant efficiency from the region of interest (ROI) (kidney) in mice injected with siRNA (n=3) and chitosan/siRNA (n=4) at the indicated time points is presented (NS - not scanned at this time point for siRNA injected mice). Significant difference for the fluorescent intensity was seen between the two groups at 3 hrs and 24 hrs (p<0.05 evaluated by Student t-test). (c) Ex vivo imaging of dissected organs 24 or 48 hrs after administration of chitosan/siRNA nanoparticle or buffer (only at 24 hrs), including kidneys (arrows), stomach, liver, intestine/colon, spleen, lung, and heart. Strong Cy5 signal was only observed in the kidney except a prominent auto-fluorescence signal originated from feed in the stomach.
Figure 5
Figure 5
Efficient gene silencing of AQP1 gene in vitro and in vivo: Three siRNA targeted against murine AQP1 (A-siR20, A-siR21 and A-siR22) were transfected in duplicate into AQP1-MDCK cells using Lipofectamine 2000. Non-transfected cells (Ctrl) or cells transfected with siRNA against EGFP (EGFPsiR) were included as controls. Cells were harvested 48 hrs post transfection and AQP1 mRNA (a) and protein levels (b) were evaluated by quantitative RT-PCR and western blotting, respectively. (c) A-siR22 or EGFPsiR was LNA modified in the 2-nucleotides overhangs for in vivo experiments and formulated with chitosan. Thirty micrograms of A-siR22 or EGFPsiR (equal to 1.2mg/kg body weight for 25g mice) were administrated i.v. at day 0, 3, and 5 (n=5). Buffer was injected as control (n=5). The experiment was terminated at day 7, and the kidneys were collected. Total RNA was isolated and northern blotting was performed using sense strands from siRNA targeted against EGFP or AQP1 as probes. A major band migrating as intact guide strands was detected for both probes whereas no signal was observed in mice injected with buffer. One nanogram of siRNA duplex was loaded as control (Ctrl). (d), AQP1 mRNA and protein levels were evaluated by quantitative RT-PCR and western blotting, respectively. Both AQP1 mRNA and protein expression were normalized with β-actin and presented as mean±SD (n=5). A significant reduction (p<0.01 evaluated by One way Analysis of Variance) in AQP1 mRNA and protein levels compared to either buffer alone or EGFPsiR/buffer was detected in mice injected with A-siR22. (e), Immunohistochemical staining of AQP1 demonstrated that AQP1 protein levels are decreased in PTECs, but not at thin limbs of Henle's loop. The knockdown in PTECs was only observed in mice injected with A-siR22 and not in the control group injected with EGFPsiR, a representative region was magnified within in a square at the corner.
Figure 5
Figure 5
Efficient gene silencing of AQP1 gene in vitro and in vivo: Three siRNA targeted against murine AQP1 (A-siR20, A-siR21 and A-siR22) were transfected in duplicate into AQP1-MDCK cells using Lipofectamine 2000. Non-transfected cells (Ctrl) or cells transfected with siRNA against EGFP (EGFPsiR) were included as controls. Cells were harvested 48 hrs post transfection and AQP1 mRNA (a) and protein levels (b) were evaluated by quantitative RT-PCR and western blotting, respectively. (c) A-siR22 or EGFPsiR was LNA modified in the 2-nucleotides overhangs for in vivo experiments and formulated with chitosan. Thirty micrograms of A-siR22 or EGFPsiR (equal to 1.2mg/kg body weight for 25g mice) were administrated i.v. at day 0, 3, and 5 (n=5). Buffer was injected as control (n=5). The experiment was terminated at day 7, and the kidneys were collected. Total RNA was isolated and northern blotting was performed using sense strands from siRNA targeted against EGFP or AQP1 as probes. A major band migrating as intact guide strands was detected for both probes whereas no signal was observed in mice injected with buffer. One nanogram of siRNA duplex was loaded as control (Ctrl). (d), AQP1 mRNA and protein levels were evaluated by quantitative RT-PCR and western blotting, respectively. Both AQP1 mRNA and protein expression were normalized with β-actin and presented as mean±SD (n=5). A significant reduction (p<0.01 evaluated by One way Analysis of Variance) in AQP1 mRNA and protein levels compared to either buffer alone or EGFPsiR/buffer was detected in mice injected with A-siR22. (e), Immunohistochemical staining of AQP1 demonstrated that AQP1 protein levels are decreased in PTECs, but not at thin limbs of Henle's loop. The knockdown in PTECs was only observed in mice injected with A-siR22 and not in the control group injected with EGFPsiR, a representative region was magnified within in a square at the corner.

References

    1. Dolman ME, Harmsen S, Storm G, Hennink WE, Kok RJ. Drug targeting to the kidney: Advances in the active targeting of therapeutics to proximal tubular cells. Adv Drug Deliv Rev. 2010;62:1344–1357. - PubMed
    1. Abbate M, Zoja C, Remuzzi G. How does proteinuria cause progressive renal damage? J Am Soc Nephrol. 2006;17:2974–2984. - PubMed
    1. Kanasty RL, Whitehead KA, Vegas AJ, Anderson DG. Action and reaction: the biological response to siRNA and its delivery vehicles. Mol Ther. 2012;20:513–524. - PMC - PubMed
    1. Bramsen JB, Kjems J. Development of Therapeutic-Grade Small Interfering RNAs by Chemical Engineering. Front Genet. 2012;3:154. - PMC - PubMed
    1. Zhang X, Shan P, Jiang D, Noble PW, Abraham NG, Kappas A. et al. Small interfering RNA targeting heme oxygenase-1 enhances ischemia-reperfusion-induced lung apoptosis. J Biol Chem. 2004;279:10677–10684. - PubMed

Publication types

MeSH terms

LinkOut - more resources