. 2014 Dec;1843(12):2855-70.
doi: 10.1016/j.bbamcr.2014.08.008. Epub 2014 Aug 23.

Human erythrocyte band 3 functions as a receptor for the sialic acid-independent invasion of Plasmodium falciparum. Role of the RhopH3-MSP1 complex

Affiliations

Human erythrocyte band 3 functions as a receptor for the sialic acid-independent invasion of Plasmodium falciparum. Role of the RhopH3-MSP1 complex

Michael Baldwin et al. Biochim Biophys Acta. 2014 Dec.

Abstract

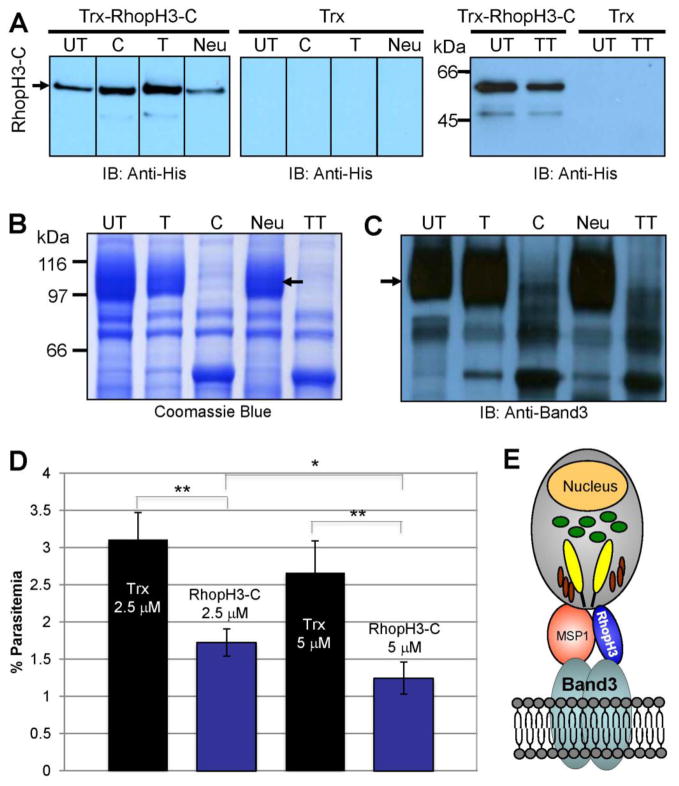
Plasmodium falciparum takes advantage of two broadly defined alternate invasion pathways when infecting human erythrocytes: one that depends on and the other that is independent of host sialic acid residues on the erythrocyte surface. Within the sialic acid-dependent (SAD) and sialic acid-independent (SAID) invasion pathways, several alternate host receptors are used by P. falciparum based on its particular invasion phenotype. Earlier, we reported that two putative extracellular regions of human erythrocyte band 3 termed 5C and 6A function as host invasion receptor segments binding parasite proteins MSP1 and MSP9 via a SAID mechanism. In this study, we developed two mono-specific anti-peptide chicken IgY antibodies to demonstrate that the 5C and 6A regions of band 3 are exposed on the surface of human erythrocytes. These antibodies inhibited erythrocyte invasion by the P. falciparum 3D7 and 7G8 strains (SAID invasion phenotype), and the blocking effect was enhanced in sialic acid-depleted erythrocytes. In contrast, the IgY antibodies had only a marginal inhibitory effect on FCR3 and Dd2 strains (SAD invasion phenotype). A direct biochemical interaction between erythrocyte band 3 epitopes and parasite RhopH3, identified by the yeast two-hybrid screen, was established. RhopH3 formed a complex with MSP119 and the 5ABC region of band 3, and a recombinant segment of RhopH3 inhibited parasite invasion in human erythrocytes. Together, these findings provide evidence that erythrocyte band 3 functions as a major host invasion receptor in the SAID invasion pathway by assembling a multi-protein complex composed of parasite ligands RhopH3 and MSP1.

Keywords: Band 3; Chicken antibody; Erythrocyte; MSP1; Plasmodium falciparum; RhopH3.


Figures

Fig. 1
Fig. 1
Generation of anti-band 3 IgY antibodies. (A) Alignment of the amino acid sequences of 5ABC, Δ5ABC, and 6A regions of human, chicken, and mouse RBC band 3. Chicken and mouse sequences divergent from the human sequence are shown in red and underscored. Peptides patterned on the human 5C and 6A sequence to produce antibodies in chicken are underlined. (B) Western blot showing mono-specific anti-5C (left panel) and anti-6A (right panel) IgY antibodies are reactive against the 5ABC and 6A domain of purified GST-fusion proteins, respectively. Lanes 1 and 4, GST; Lanes 2 and 5, GST-6A, Lanes 3 and 6, GST-5ABC. (C) Western blot showing anti-5C and anti-6A IgY antibodies reacting to full-length band 3 in human RBC ghosts. A truncated band 3 band is also observed. Anti-band 3 mAb against the N-terminal cytoplasmic domain (B3/cd) and preimmune IgY were used as controls. Neu− (no Neu treatment), ghosts from normal human RBCs. Neu+ (Neu treatment), ghosts from neuraminidase-treated intact human RBCs. (D) Staining of a polyacrylamide gel using Glyco-Pro (see Experimental Procedures) to verify the removal of sialic acid residues on the Neu-treated RBC membrane is shown. Neu− and Neu+ lanes are as above. Only in the Neu− lane, a single fluorescent band corresponding to dimeric GPA bearing most of sialic acids on the RBC surface is visible. This band is known to co-migrate with band 3, although not apparent in Coomassie-stained gels [29]. Equal loading of ghost proteins was used in all immunoblotting experiments as observed by Coomassie staining (not shown).
Fig. 2
Fig. 2
Reactivity of antibodies to fixed RBCs by indirect immunofluorescence assay. (A) Normal human RBCs reacting to anti-chicken secondary antibody (conjugated to Alexa 488), anti-GPA mAb against extracellular residues, anti-band 3 mAb against the cytoplasmic domain (anti-band 3/cd), preimmune IgY, mono-specific anti-5C IgY, and mono-specific anti-6A IgY are shown (100X magnification). Secondary antibodies were conjugated to either Alexa 488 or Alexa 594 to produce green or red fluorescence, respectively. Phase contrast is shown in the lower panel. (B) This panel shows reactivity to antibodies, as in panel A, in the neuraminidase-treated (Neu) RBCs.
Fig. 3
Fig. 3
Binding of antibodies to intact RBCs by flow cytometry. Binding data obtained by flow cytometry were analyzed using histograms (x-axis, fluorescence intensity in logarithmic scale; y-axis, number of events) and then plotted on an identical x-axis (100 – 104 scale) for a visual comparison of fluorescence intensity. In both normal and Neu-treated RBC samples, binding measurements were performed with the following antibodies: anti-chicken secondary antibodies as controls, anti-band 3 mAb against the cytoplasmic domain (anti-band 3/cd), anti-GPA mAb against extracellular regions, and preimmune IgY. Fluorescence intensity for the binding of mono-specific anti-5C and anti-6A IgY antibodies (100 μg/ml) to RBCs was compared with the preimmune IgY (100 μg/ml) control.
Fig. 4
Fig. 4
Binding of anti-band 3 IgY antibodies to human RBCs, and detection of parasitemia. (A) The concentration-dependent binding of anti-5C and anti-6A IgY antibodies (0, 25, 50, 100, 250 μg/ml) to human RBCs is shown. Mean fluorescence intensity (y-axis) was obtained from triplicate measurements using flow cytometry. The binding of preimmune IgY at all concentrations was insignificant. (B) Identical assay to (A) but with neuraminidase-treated RBCs. (C) Density plot analysis of parasitemia estimation by flow cytometry using SYTO-13. Culture of P. falciparum (3D7 strain) at a mixed stage was split into two samples. One sample was synchronized with sorbitol, while the other was kept as the mixed stage. When synchronized culture reached the trophozoite stage, both culture samples were fixed with 1% paraformaldehyde in PBS. An aliquot (25 μL) of the fixed sample was added to a 500 μL solution of SYTO-13 in PBS (final concentration 100 nM) and subjected to flow cytometry as described in Experimental Procedures. The density plot for each sample is shown with side scatter on the x-axis and FL2 (SYTO-13) on the y-axis, respectively, in logarithmic scale. While the mixed-stage sample (Infected/Unsync) contained young ring-stage parasites (R) as well as mature trophozoites (T), synchronized culture sample (Infected/Sync) showed predominantly trophozoites. Uninfected RBCs were used as control.
Fig. 5
Fig. 5
Histogram analysis of parasitemia by flow cytometry using SYTO-13. A mixed-stage P. falciparum culture was fixed as above and added to SYTO-13 solution to give a final concentration of SYTO-13 at 0, 12.5, 25, 50, 100, 150, and 200 nM in saline. Uninfected RBC samples were used as control. Flow cytometry data for infected and uninfected RBC samples were plotted as a histogram showing FL2 (SYTO-13) on the x-axis in logarithmic scale (100 – 104) and number of events on the y-axis. At 50 nM SYTO-13, uninfected RBCs (black arrowhead), ring-stage parasites (blue arrow), trophozoites (red arrow), and early schizonts (black arrow) had a clear baseline separation in the histogram. At 100 nM SYTO-13, there was a similar distinction of the cell populations but the background fluorescence was higher.
Fig. 6
Fig. 6
Antibody and peptide-dependent inhibition of Plasmodium falciparum invasion in RBCs. (A) RBC invasion assay was carried out using freshly added normal or (B) Neu-treated human RBCs in trophozoite-enriched P. falciparum (3D7 strain) samples having different concentrations of anti-band 3 IgY antibodies (see Experimental Procedures). Each anti-5C and anti-6A IgY was used at 0, 25, 50, 100, and 200 μg/ml concentrations either as a single inhibitor or as a mixture of the two. Newly formed ring-stage parasites were counted by the flow cytometry method using SYTO-13, and mean parasitemia (new infection) was determined from triplicate assay samples. The data are presented as percent invasion inhibition (mean ± s.e.) based on the preimmune IgY control sample taken as 0% inhibition (or 100% invasion). (C) Invasion inhibition assays were carried out for both SAID and SAD invasion phenotypes of P. falciparum. The assays were performed in triplicate using 8.0 μM of soluble recombinant proteins, GST-5ABC and GST (control). Student’s t-test was used to compare the mean. The data presented as percent invasion inhibition is based on the GST control sample taken as 0% inhibition. (D) Illustration of the proposed model of the band 3-parasite interactions occurring at both 5C and 6A regions. Invasion is reduced when these interactions are inhibited through the use of recombinant peptides or antibodies against these regions.
Fig. 7
Fig. 7
Invasion phenotype-specific inhibition of P. falciparum invasion into RBCs. (A–D) Using 100 μg/ml of anti-5C, anti-6A, and preimmune IgY as inhibitors, invasion inhibition assays were carried out for both SAID and SAD invasion phenotypes of P. falciparum. The assays were performed in triplicates using normal and Neu-treated RBCs. Flow cytometry using SYTO-13 allowed rapid analysis of multiple assay samples as described before. Results are presented as percent invasion inhibition (mean ± s.e.) where the preimmune IgY sample was taken as 0% inhibition. Student’s t-test was used to compare the mean.
Fig. 8
Fig. 8
Identification Band 3-RhopH3 interaction by the yeast two-hybrid screen. (A) Diagram of full-length RhopH3 protein with its predicted transmembrane domains colored in red [47], the antibody epitope used in this study is shown in green, and the region identified as binding to the 5ABC domain of band 3 in a Y2H screen is colored in yellow marked with arrows. Recombinant RhopH3 was expressed by excluding the predicted transmembrane domains for optimum protein stability. This construct contains an N-terminal thioredoxin (Trx) tag, and both an N-terminal and C-terminal 6-His tag, and it was termed Trx-RhopH3-C. (B) Purified recombinant proteins include Trx-RhopH3-C, its band 3-binding site (GST-5ABC), Trx-MSP119, and respective fusion tags (MBP, Trx, GST). Gel was stained with Coomassie blue. (C) Polyclonal antibody was raised against the RhopH3 peptide (amino acids 876-892), and characterized by ELISA and Western blotting. This antibody was used to confirm the identify recombinant Trx-RhopH3-C by Western blotting.
Fig. 9
Fig. 9
Biochemical interactions between RhopH3, Band 3, and MSP1. (A) The 5ABC region of band 3 was expressed as a GST fusion protein, which was then bound to GSH resin. Trx-RhopH3-C was added to the mixture and allowed to bind. After washing, bound protein was eluted and analyzed by immunoblotting against the His tag to detect RhopH3-C fusion protein. (B) Concentration-dependent binding of soluble Trx-RhopH3-C (0–5 μM) to GST-5ABC (0.1 μM) immobilized to an ELISA plate. The values are (means ± S.D.), and the dissociation constant was estimated from duplicate measurements. The ligand binding curves are shown in the range of 0–5 μM. Trx binding to GST-5ABC and GST was insignificant. (C) MSP119 expressed as MBP fusion protein was immobilized to amylose beads. Trx-RhopH3-C was added to the mixture, allowed to bind, washed, and eluted. Immunoblotting against the His tag was used to detect the RhopH3-C fusion protein. (D) Concentration-dependent binding of soluble MBP-MSP119 (0–6 μM) to Trx-RhopH3-C (0.1 μM) immobilized to an ELISA plate. The ligand binding curves are shown in the range of 0–6 μM. Trx-RhopH3 binding to MBP and Trx binding to MBP were insignificant. (E) Parasite culture supernatant was incubated with immobilized GST-5ABC protein, and binding was detected by immunoblotting using anti-RhopH3 serum. All pull-down binding assays were performed at least two times and some were repeated 4–5 times.
Fig. 10
Fig. 10
Competitive displacement of interactions between RhopH3, Band 3, and MSP1 binding domains. (A) 5ABC peptide of band 3 was expressed as GST fusion protein bound to GSH resin beads. Beads were allowed to interact with Trx-RhopH3-C, followed by the addition Trx-MSP119 at varying concentrations. (B) Bound proteins were eluted and analyzed by immunoblotting against the His tag to detect Trx-RhopH3-C and Trx-MSP119 fusion proteins. Trx-RhopH3-C was added to saturate the binding sites of GST-5ABC on beads. Increasing amounts of Trx-MSP119 were added to determine the displacement of RhopH3-C interaction with the GST-5ABC peptide immobilized onto beads.
Fig. 11
Fig. 11
RhopH3 binds to RBCs and inhibits parasite invasion. (A) Untreated and enzyme-treated RBCs were incubated with Trx-RhopH3-C to allow binding. RBCs were washed and bound Trx-RhopH3-C was eluted with high NaCl. Eluted protein was analyzed by immunoblotting as described before. (B) Untreated and enzyme-treated human RBCs were used to prepare ghosts for analysis by SDS-PAGE and Coomassie blue staining. (C) Western blotting of the material shown in panel B using an anti-band 3 antibody. The arrow indicates the position of band 3 in untreated RBC ghosts. UT, untreated; C, chymotrypsin-treated; T, trypsin-treated; Neu, neuraminidase-treated; TT, Triple-treated C+T+Neu. (D) Invasion inhibition assay was carried out using the 3D7 strain of P. falciparum. The invasion assays were performed in triplicate at 2.5 and 5 μM concentrations due to the limitation of protein stability of recombinant Trx-RhopH3-C under these conditions. Trx protein was used as a negative control. (E) Proposed model of merozoite attachment to RBCs via interactions involving band 3, MSP1, and RhopH3.

References

    1. Oh SS, Chishti AH. Host receptors in malaria merozoite invasion. Curr Top Microbiol Immunol. 2005;295:203–232. - PubMed
    1. Cowman AF, Berry D, Baum J. The cellular and molecular basis for malaria parasite invasion of the human red blood cell. J Cell Biol. 2012;198:961–971. - PMC - PubMed
    1. Okoyeh JN, Pillai CR, Chitnis CE. Plasmodium falciparum field isolates commonly use erythrocyte invasion pathways that are independent of sialic acid residues of glycophorin A. Infect Immun. 1999;67:5784–5791. - PMC - PubMed
    1. Baum J, Pinder M, Conway DJ. Erythrocyte invasion phenotypes of Plasmodium falciparum in The Gambia. Infect Immun. 2003;71:1856–1863. - PMC - PubMed
    1. Lobo CA, de Frazao K, Rodriguez M, Reid M, Zalis M, Lustigman S. Invasion profiles of Brazilian field isolates of Plasmodium falciparum: phenotypic and genotypic analyses. Infect Immun. 2004;72:5886–5891. - PMC - PubMed

LinkOut - more resources