. 2014 Aug 27:4:6205.
doi: 10.1038/srep06205.

Microbial communities evolve faster in extreme environments

Affiliations

Microbial communities evolve faster in extreme environments

Sheng-Jin Li et al. Sci Rep. .

Abstract

Evolutionary analysis of microbes at the community level represents a new research avenue linking ecological patterns to evolutionary processes, but remains insufficiently studied. Here we report a relative evolutionary rates (rERs) analysis of microbial communities from six diverse natural environments based on 40 metagenomic samples. We show that the rERs of microbial communities are mainly shaped by environmental conditions, and the microbes inhabiting extreme habitats (acid mine drainage, saline lake and hot spring) evolve faster than those populating benign environments (surface ocean, fresh water and soil). These findings were supported by the observation of more relaxed purifying selection and potentially frequent horizontal gene transfers in communities from extreme habitats. The mechanism of high rERs was proposed as high mutation rates imposed by stressful conditions during the evolutionary processes. This study brings us one stage closer to an understanding of the evolutionary mechanisms underlying the adaptation of microbes to extreme environments.


Figures

Figure 1
Figure 1. Discriminant analysis of principal components (DAPC) based on relative abundances of COG categories showing habitat profiling of 40 microbial communities across six habitats.
The six habitats were denoted by corresponding cluster and colors.
Figure 2
Figure 2. Scatter plot showing the distribution of rERs of the six habitat categories, based on the pooled data of all samples in each category.
The 5%, 25%, 50%, 75%, and 90% quartiles are indicated. The significant differences of rERs among different habitat categories were determined using pairwise Mann–Whitney U-tests based on the average rER for each habitat as displayed in Supplementary Table S1. (*P < 0.05; **P < 0.01; α = 0.05, two-tailed. All P-values were adjusted for multiple testing using the “BH” correction in R. Detailed P-values were listed as follows: saline lake vs. freshwater, 0.029; saline lake vs. soil, 0.010; saline lake vs. hot spring, 0.033; AMD vs. hot spring, 0.007; AMD vs. surface ocean, 0.020; AMD vs. freshwater, 0.007; AMD vs. soil, 0.007; hot spring vs. surface ocean, 0.028; hot spring vs. soil, 0.040; surface water vs. freshwater, 0.017; surface water vs. soil, 0.007; freshwater vs. soil, 0.020).
Figure 3
Figure 3. The rERs of natural communities apparently deviating from the expected values of the simulated samples.
Of all 36 samples (the five subsamples from AMD C75 were pooled), 28 (78%) deviated from expectations (two-sided Kolmogorov-Smirnov tests, P < 0.05, α = 0.05). (a) HOT 110 m is shown as representative of the deviated groups, and (b) soil J1b-10 represents those that are consistent with expectations. (c) The detailed P-values and deviations (denoted by median) are illustrated in the heatmap.
Figure 4
Figure 4. Clustering analyses based on the community-scale evolutionary variables (rER, dN/dS, transposases, and species diversity) generally divide the samples into the categories of “extreme” (AMD, hot spring, saline lake) and “normal” (surface ocean, freshwater, soil).
Figure 5
Figure 5. Detection of significantly higher overall community rER, dN/dS and relative abundance of transposases in extreme habitats than in normal ones (Mann-Whitney U-tests; ***P < 0.001. P-values were equal to 2.81E-04, 2.77E-05, 2.623E-05 respectively. α = 0.001, one-tailed).
Figure 6
Figure 6. Correlation between community rERs of the six habitat categories and their species diversity estimates (ACE).
Figure 7
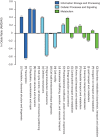
Figure 7. Odds ratio of the AMD genes compared to those from all sequenced prokaryotes for the genes annotated as COG functional categories.
Asterisks denote a significant deviation from the null hypothesis (ln odds ratio = 0) (one-tailed Fisher exact test; *P < 0.01; **P < 0.001, α = 0.01).

References

    1. Allen E. E. & Banfield J. F. Community genomics in microbial ecology and evolution. Nat. Rev. Microbiol. 3, 489–498 (2005). - PubMed
    1. Denef V. J., Mueller R. S. & Banfield J. F. AMD biofilms: using model communities to study microbial evolution and ecological complexity in nature. ISME J. 4, 599–610 (2010). - PubMed
    1. Rothschild L. J. & Mancinelli R. L. Life in extreme environments. Nature 409, 1092–1101 (2001). - PubMed
    1. Ghai R. et al. New abundant microbial groups in aquatic hypersaline environments. Sci. Rep. 1, 135 (2011). - PMC - PubMed
    1. Kuang J. L. et al. Contemporary environmental variation determines microbial diversity patterns in acid mine drainage. ISME J. 7, 1038–1050 (2012). - PMC - PubMed

Publication types

LinkOut - more resources