. 2014 Sep 11;8(5):1280-9.
doi: 10.1016/j.celrep.2014.07.043. Epub 2014 Aug 21.

Single-cell, genome-wide sequencing identifies clonal somatic copy-number variation in the human brain

Affiliations

Single-cell, genome-wide sequencing identifies clonal somatic copy-number variation in the human brain

Xuyu Cai et al. Cell Rep. .

Erratum in

Abstract

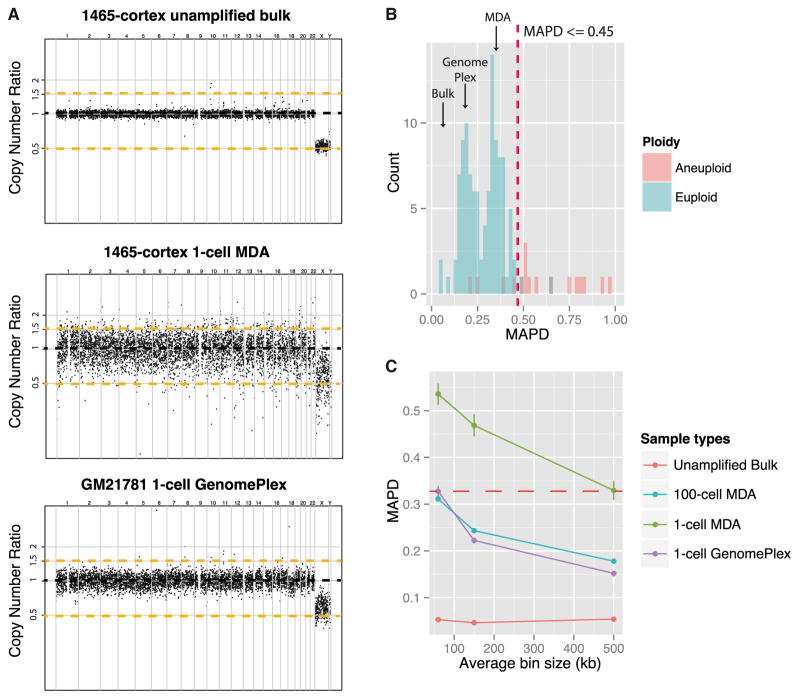
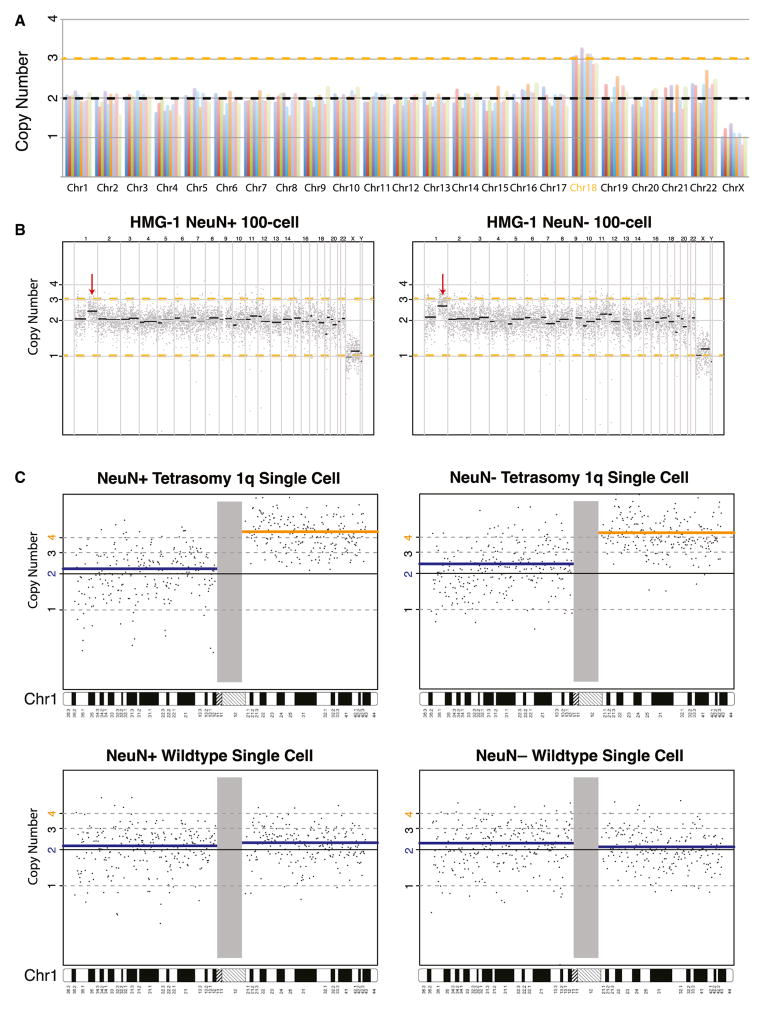
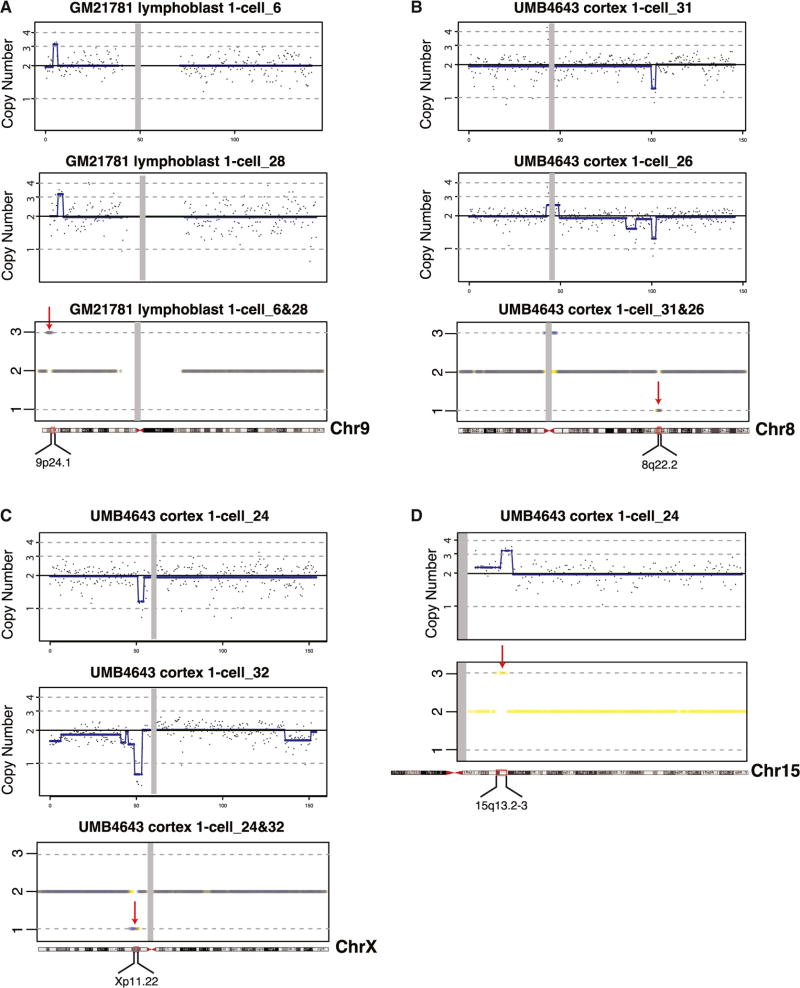
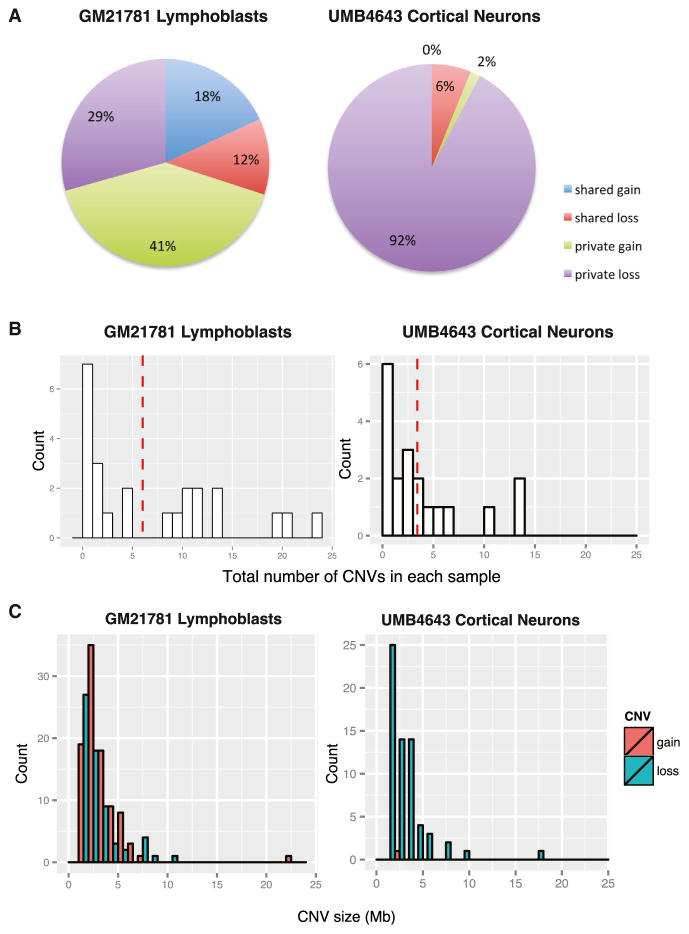
De novo copy-number variants (CNVs) can cause neuropsychiatric disease, but the degree to which they occur somatically, and during development, is unknown. Single-cell whole-genome sequencing (WGS) in >200 single cells, including >160 neurons from three normal and two pathological human brains, sensitively identified germline trisomy of chromosome 18 but found most (≥ 95%) neurons in normal brain tissue to be euploid. Analysis of a patient with hemimegalencephaly (HMG) due to a somatic CNV of chromosome 1q found unexpected tetrasomy 1q in ∼ 20% of neurons, suggesting that CNVs in a minority of cells can cause widespread brain dysfunction. Single-cell analysis identified large (>1 Mb) clonal CNVs in lymphoblasts and in single neurons from normal human brain tissue, suggesting that some CNVs occur during neurogenesis. Many neurons contained one or more large candidate private CNVs, including one at chromosome 15q13.2-13.3, a site of duplication in neuropsychiatric conditions. Large private and clonal somatic CNVs occur in normal and diseased human brains.


Figures

Figure 1
Figure 1. CN Analysis from Low-Coverage WGS
(A) Comparison of WGS CN analysis in unamplified DNA, single-cell MDA, and single-cell GenomePlex. The x axis represents 6,000 bins across the genome. The y axis represents the log2 CN ratio of each bin relative to the expected CN based on a simulated reference (see Experimental Procedures). Black dashed lines indicate CN of 2 and orange dashed lines indicate CN of 1 and 3. Each chromosome is divided by vertical lines and labeled on top of the graph. Note that unamplified bulk DNA gives the clearest signal, while single-cell samples are noisier, especially MDA, but still allow recognition of sex chromosome differences in these male samples. (B) MAPD scores for WGS CN analysis of unamplified DNA samples, and single-cell genomes analyzed using GenomePlex or MDA. The histogram shows MAPD scores of all sequenced samples from normal individuals. Bulk (unamplified) DNA gives the best (lowest) MAPD scores (mean = 0.06 ± 0.02, n = 3), whereas GenomePlex (mean = 0.20 ± 0.05, n = 54) gives generally lower MAPD scores than MDA (mean = 0.45 ± 0.17, n = 89), and MDA samples form a long tail of high MAPD scores suggesting low quality (also see Figure S1). Most samples were called euploid (n = 111) and fewer were called aneuploid (n = 17), and most aneuploid cells had high MAPD scores suggesting unreliable calls. A total of 113 samples passed MAPD threshold ≤ 0.45 (red dash line) and 15 samples failed, all amplified by MDA, including three that failed initial multiplex-PCR quality control. Among samples with MAPD ≤ 0.45, 109 out of 113 were euploid and 4 out of 113 were potentially aneuploid. (C) Effect of bin size on CN data noise. Average MAPD score of bulk, MDA, and GenomePlex single-cell samples plotted for 500 kb (6,000 bins total), 150 kb (20,000 bins), and 60 kb (50,000 bins) bins. At each bin size, the average reads per bin is normalized to ~500 for MDA and ~250 for GenomePlex and bulk samples. MAPD of both MDA and GenomePlex samples increases with decreasing average bin size, whereas the MAPD score of bulk DNA remains unchanged with bin sizes, suggesting that both amplifications introduce more prominent noise at smaller local regions (n = 2 for bulk; n = 4 for MDA single cells; n = 1 for MDA 100-cell; and n = 4 for GenomePlex single cells; error bar, ±SD). The red dashed line indicates that the CN noise of MDA samples at 500 kb bin size is comparable to the CN noise of GenomePlex single-cell samples at 60 kb average bin size; MAPD scores equal 0.33 ± 0.02 and 0.33 ± 0.01 (error = ±SD), respectively. The increased noise from MDA samples can be partially compensated by reducing CN resolution. GenomePlex data are from Navin et al. (2011), due to insufficient sequencing depth of our own GenomePlex data, and were used to compare with four wild-type single-cortical neurons and one 100-caudate neuron sample amplified by MDA.
Figure 2
Figure 2. Chromosomal Aneuploidy and CNV Analysis of Single Neurons from Trisomy 18 and 1q CNV Brains
(A) All nine single neuron genomes with germline trisomy 18 showed CN increase at chromosome 18. Chromosome CN of single cortical neurons from a tri18 (UMB866, 47XY, +18) individual demonstrates 100% sensitivity in detecting the CN gain at chromosome 18. CNs are normalized to the median CN of each chromosome across the five wild-type single neurons, with autosomes adjusted to a median CN of 2. Orange line denotes CN 3. (B) The 100-cell samples from HMG-1 brain, carrying a clonal 1q CNV, show that both NeuN+ and NeuN− populations showed noninteger CN increase at chr1q (red arrow). Gray dots denote CN of each genomic bin, and black lines denote the medium CN of each chromosome arm. Orange dashed lines denote CN 1 and 3. (C) CN plots at chromosome 1 of single-cell samples from both the NeuN+ and NeuN− populations showed four copies of chr1q in a fraction of samples and normal CN 2 in the rest of the samples. Blue and orange lines denote median CN of each chromosome arm. The blue line represents chromosome arms with CN 2, and the orange line represents chromosome arms with CN 4.
Figure 3
Figure 3. Mosaic Clonal CNVs Identified from Normal Lymphoblast Cells and Neurons
(A) Example of a clonal CNV identified from lymphoblast GM21781. A ~1.9Mb CN gain at chr9 (chr9: 4,250,567–6,148,270) (indicated by red arrow) shared by multiple lymphoblasts (also see Figure S3B). Gray dots denote raw CN of each bin, and the blue line denotes the segmentation means of each CN segment, used for CN calls. The gray rectangle roughly defines boundaries of centromere. The bottom panel overlays CN calls of both single lymphoblasts. (B) Clonal CNV identified in UMB4643 cortical neurons. A ~1.9 Mb CN loss at chr8 (chr8: 100,204,912–102,089,812) (indicated by red arrow) is shared by two single neurons from 4643 cortex. The bottom panel overlays CN calls of both single neurons. A false-positive call at the centromere was filtered from the final call set. (C) Clonal CNV identified in UMB4643 cortical neurons. A ~2.3 Mb CN loss at chrX (chrX: 51,160,992–53,500,796) (indicated by red arrow) is shared by two single neurons from 4643 cortex. The bottom panel compares CN calls of both single neurons, emphasizing that they are closely in register. (D) 15q13 duplication identified in a single UMB4643 cortical neuron. An ~3 Mb CN gain at chr15 (chr15: 30,231,607–33,177,781) (indicated by red arrow), identified in a single neuron from UMB4643 cortex, overlaps the site of a recurrent CNV associated with ASD. The bottom panel shows the CN calls of UMB4643 cortex 1-cell_24 on chromosome 15.
Figure 4
Figure 4. Comparative CNV Landscape in Lymphoblasts and Cortical Neurons
(A) Pie chart summarizes CNVs identified from single lymphoblasts versus single neurons. Approximately 30% (18% CN gains and 12% losses) of CNVs identified from single lymphoblasts are clonal, whereas only 6% (6% CN losses and 0% gain) of CNVs identified from single neurons are clonal. CNVs identified from single neurons are predominately private losses, whereas CNVs identified from single lymphoblasts are balanced between losses and gains. (B) Histogram of total candidate CNVs identified in each single cell. Left: histogram of CNVs identified in each single lymphoblast (n = 24) shows that most single cells harbor less than five CNVs, though three outlier cells show larger numbers. The red dashed line shows the average CNVs per lymphoblast (6.7). Right: histogram of CNVs identified in each single neuron (n = 19), showing that most single neurons harbor less than five CNVs, with three outliers showing larger numbers. The red dashed line represents the average number of CNVs per neuron at 3.4. (C) Size distribution of CNVs identified from single cells. Left: size distribution of all CNVs identified in single lymphoblasts (n = 160). Most are less than 5 Mb with one outlier at 22 Mb, without obvious differences in size distribution between losses (green bars) and gains (red bars). Right: size distribution of CNVs identified in single neurons (n = 65). Most are <5 Mb with one outlier at 18 Mb. The only gain (red bar) identified is on the small end of the size distribution.

References

    1. Abyzov A, Mariani J, Palejev D, Zhang Y, Haney MS, Tomasini L, Ferrandino AF, Rosenberg Belmaker LA, Szekely A, Wilson M, et al. Somatic copy number mosaicism in human skin revealed by induced pluripotent stem cells. Nature. 2012;492:438–442. - PMC - PubMed
    1. Affymetrix. Median of the absolute values of all pairwise differences and quality control on Affymetrix genome-wide human SNP array 6.0. 2008 http://media.affymetrix.com/support/technical/whitepapers/mapd_snp6_whit....
    1. Ball MP, Thakuria JV, Zaranek AW, Clegg T, Rosenbaum AM, Wu X, Angrist M, Bhak J, Bobe J, Callow MJ, et al. A public resource facilitating clinical use of genomes. Proc Natl Acad Sci USA. 2012;109:11920–11927. - PMC - PubMed
    1. Baslan T, Kendall J, Rodgers L, Cox H, Riggs M, Stepansky A, Troge J, Ravi K, Esposito D, Lakshmi B, et al. Genome-wide copy number analysis of single cells. Nat Protoc. 2012;7:1024–1041. - PMC - PubMed
    1. Beverstock GC, Mollevanger P, Baaij M, Lind J, van Ieperen L, Bartelings MM, Teunissen K, Brandenburg H, Van Opstal D, Los F. Nasopharyngeal teratoma and mosaic tetrasomy 1q detected at amniocentesis. A case report and review of the literature. Cancer Genet Cytogenet. 1999;115:11–18. - PubMed

Publication types