. 2014 Sep 11;8(5):1545-57.
doi: 10.1016/j.celrep.2014.07.049. Epub 2014 Aug 21.

The multifunctional sorting protein PACS-2 regulates SIRT1-mediated deacetylation of p53 to modulate p21-dependent cell-cycle arrest

Affiliations

The multifunctional sorting protein PACS-2 regulates SIRT1-mediated deacetylation of p53 to modulate p21-dependent cell-cycle arrest

Katelyn M Atkins et al. Cell Rep. .

Abstract

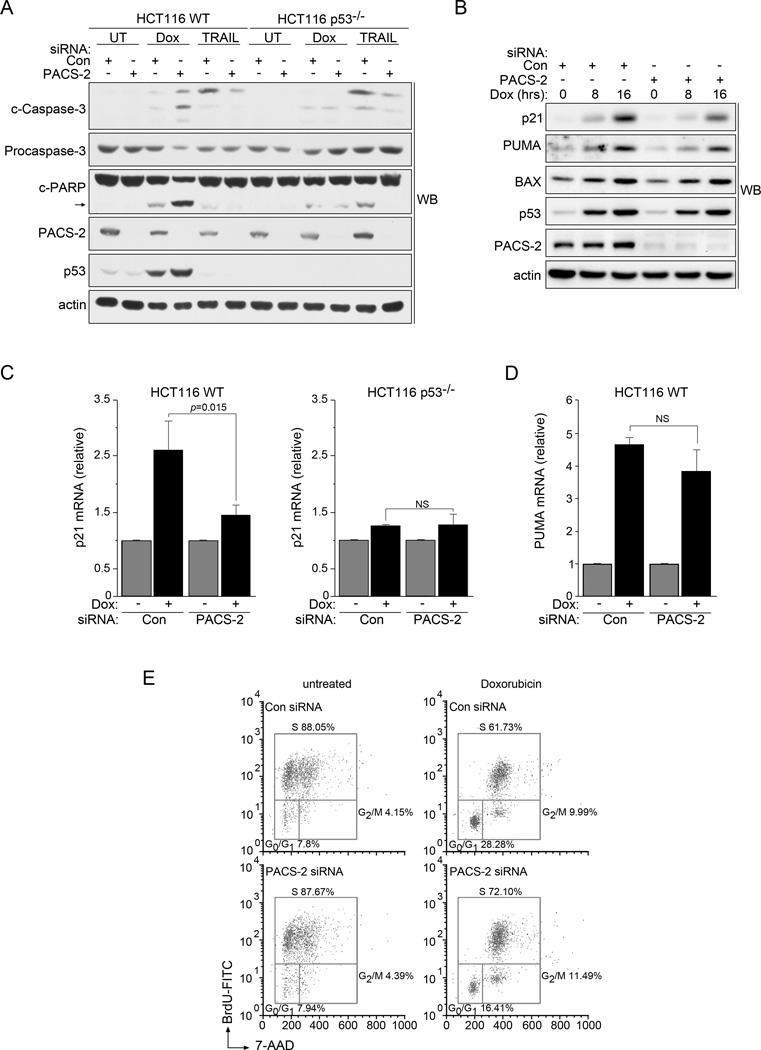
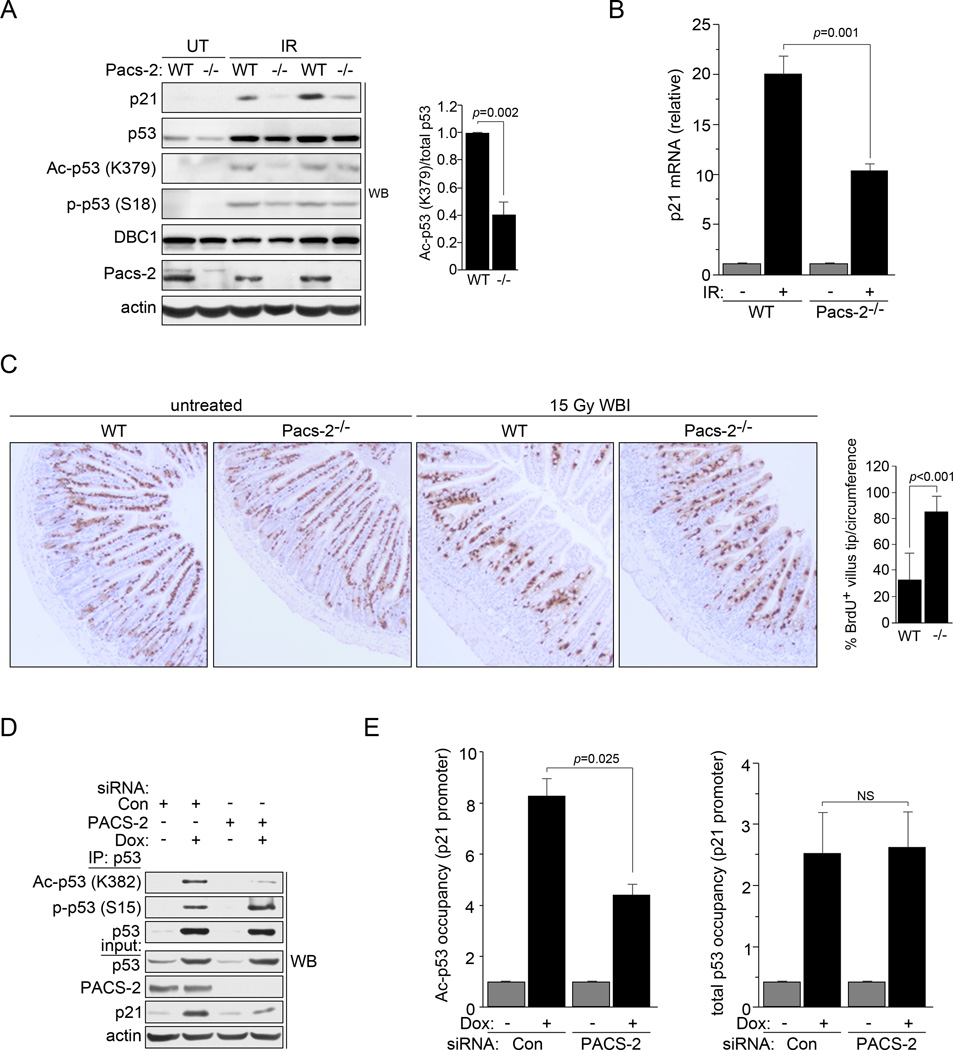
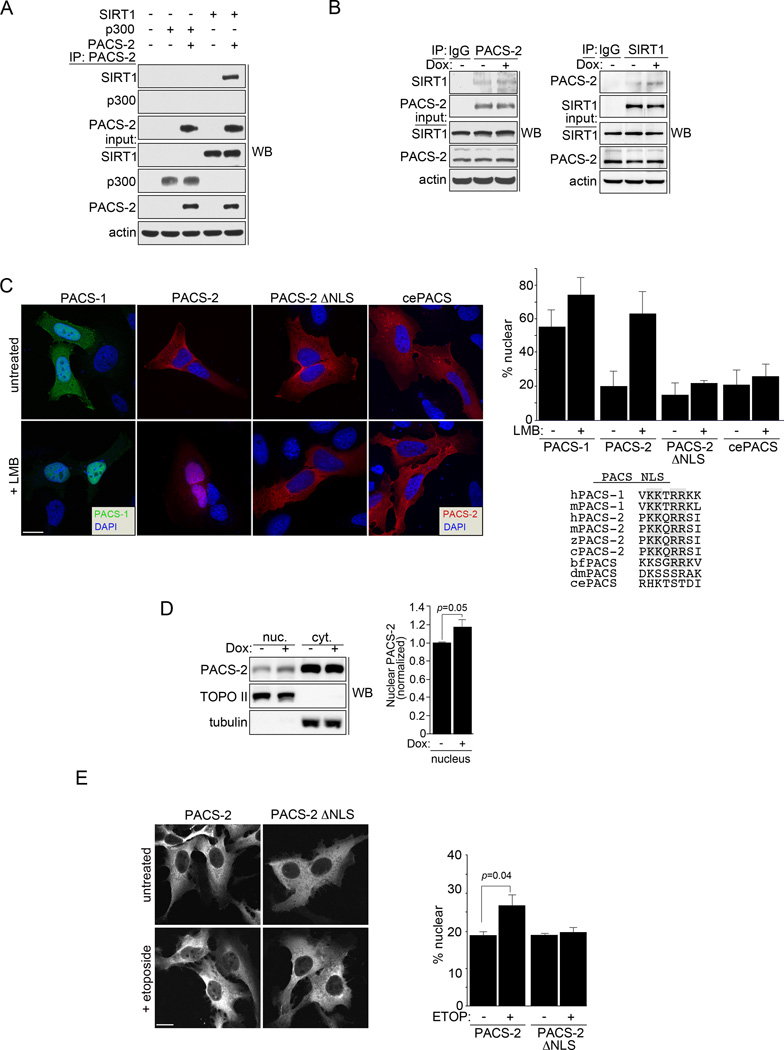
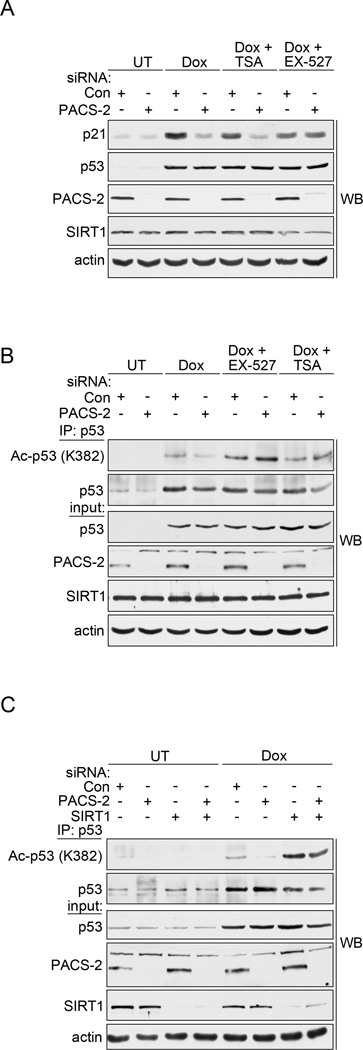
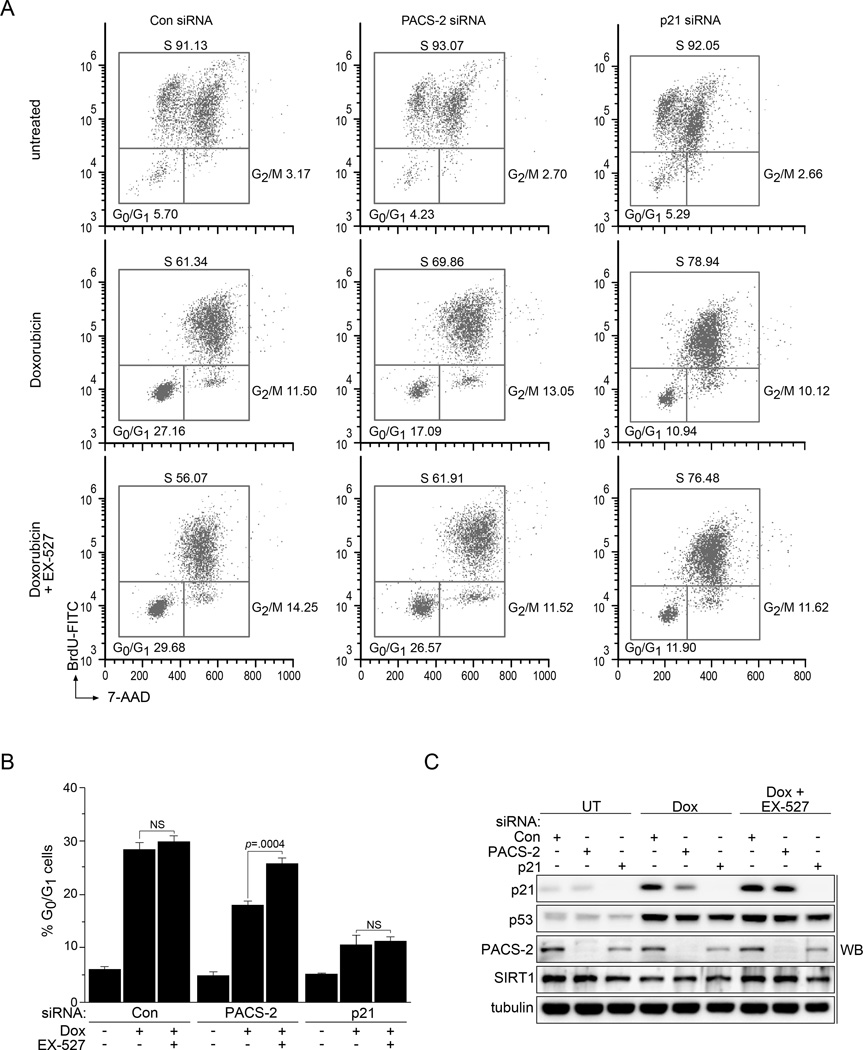
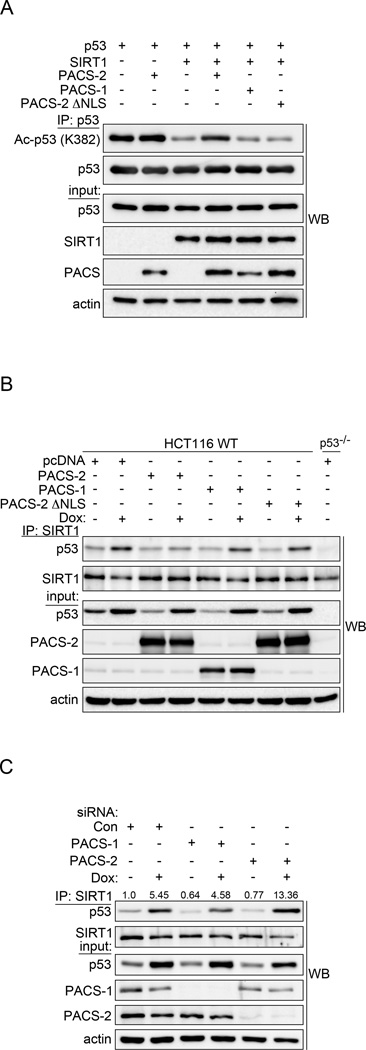
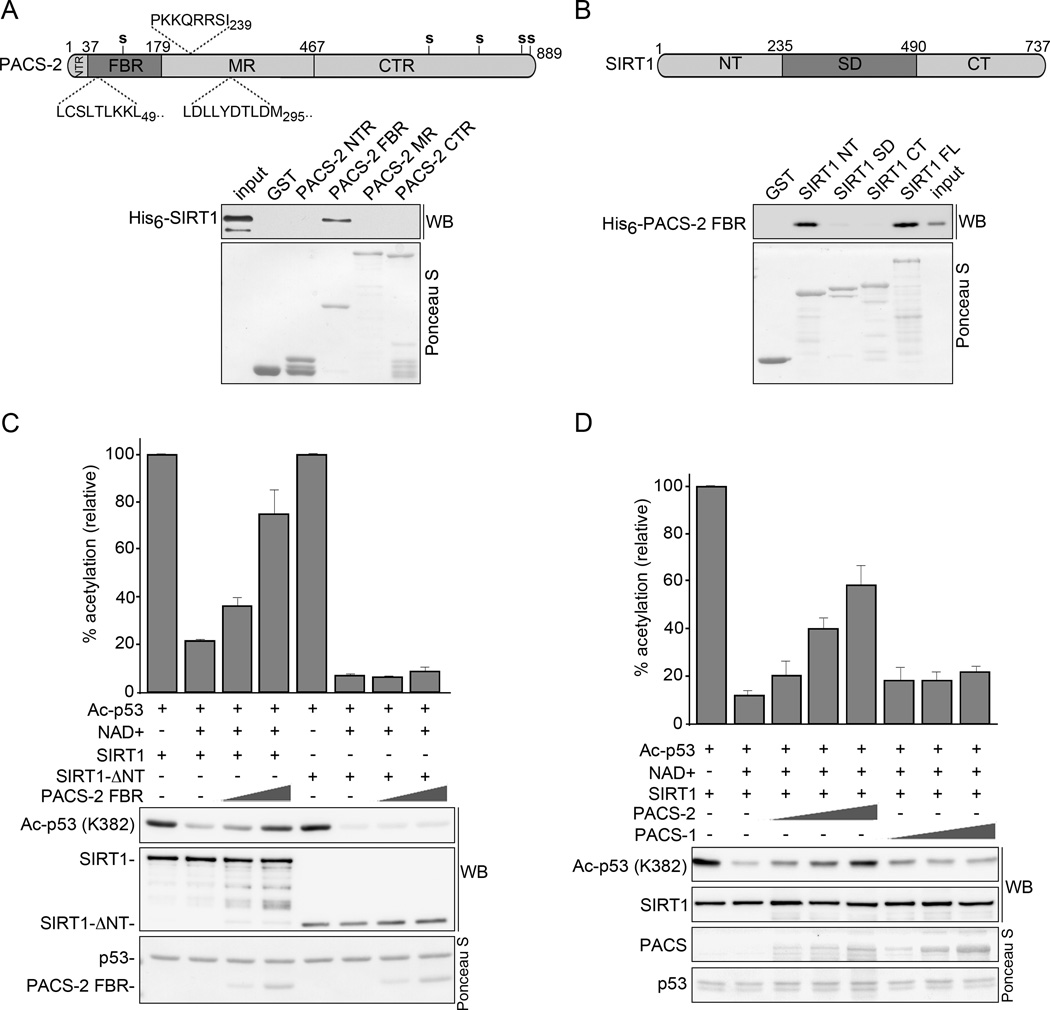
SIRT1 regulates the DNA damage response by deacetylating p53, thereby repressing p53 transcriptional output. Here, we demonstrate that the sorting protein PACS-2 regulates SIRT1-mediated deacetylation of p53 to modulate the DNA damage response. PACS-2 knockdown cells failed to efficiently undergo p53-induced cell-cycle arrest in response to DNA damage. Accordingly, p53 acetylation was reduced both in PACS-2 knockdown cells and thymocytes from Pacs-2(-/-) mice, thereby blunting induction of the cyclin-dependent kinase inhibitor p21 (CDKN1A). The SIRT1 inhibitor EX-527 or SIRT1 knockdown restored p53 acetylation and p21 induction as well as p21-dependent cell-cycle arrest in PACS-2 knockdown cells. Trafficking studies revealed that cytoplasmic PACS-2 shuttled to the nucleus, where it interacted with SIRT1 and repressed SIRT1-mediated p53 deacetylation. Correspondingly, in vitro assays demonstrated that PACS-2 directly inhibited SIRT1-catalyzed p53 deacetylation. Together, these findings identify PACS-2 as an in vivo mediator of the SIRT1-p53-p21 axis that modulates the DNA damage response.


Figures

Figure 1
Figure 1. PACS-2 deficient cells have reduced p21-dependent cell cycle arrest following DNA damage
(A) Control (Con) or PACS-2 siRNA-treated HCT116 WT or p53−/− cells were treated with 0.5 µM Dox for 48hr or 20 ng/mL TRAIL for 5hr prior to harvest and analyzed by western blot. The cleaved caspase-3 Ab detected 19, 17 and 15 kDa forms. Arrow denotes cleaved PARP. (B) Control (Con) or PACS-2 siRNA-treated HCT116 cells were treated with 0.5 µM Dox and analyzed by western blot. Quantification using AlphaView (Protein Simple) showed that after 16 hr Dox treatment, PACS-2 knockdown reduced p21 by 50% whereas PUMA and Bax were less affected (16% and 12% reduction, respectively). (C) Control (Con) or PACS-2 siRNA-treated HCT116 WT (left) or HCT116 p53−/− (right) cells were treated with 0.5 µM Dox (4hr) and analyzed by qRT-PCR (normalized to GAPDH). Error bars represent mean ± SD from ≥ 3 independent experiments. Statistical significance determined using Student’s t-test. (D) HCT116 WT cells from panel B were analyzed for PUMA mRNA by qRT-PCR (normalized to GAPDH). Error bars represent mean ± SD from four independent experiments. Statistical significance determined using Student’s t-test. (E) Synchronized control (Con) or PACS-2 siRNA-treated HCT116 cells were stimulated to re-enter the cell cycle in the presence of 10 µM BrdU, treated with 0.5 µM Dox (24hr) and processed for flow cytometry. Results are representative of 3 independent experiments. See also Table S1 and Figures S1 and S2. NS, not significant.
Figure 2
Figure 2. PACS-2 modulates p53 acetylation in vivo following DNA damage
(A) Left: Thymuses from WT and Pacs-2−/− (−/−) mice exposed or not to 4.5 Gy IR (6hr) were analyzed by western blot. Right: Ac-p53 (K379) and total p53 were quantified using NIH Image J from IR-exposed WT or Pacs-2−/− mice. (B) Thymuses from WT and Pacs-2−/− mice exposed to 4.5 Gy IR (6hr) as indicated were analyzed for p21 induction by qRT-PCR (normalized to GAPDH). Error bars represent mean ± SEM from ≥ 4 mice per condition. Statistical significance determined using Student’s t-test. (C) Left: Small intestines from WT and Pacs-2−/− (−/−) mice were analyzed by IHC for BrdU 48hr following labeling and exposure to 15 Gy WBI as indicated. Right: Percentage of BrdU+ cells reaching the upper 1/4th of the villus tips per circumference was quantified. Error bars represent mean ± SD. Statistical significance determined using Student’s t-test. Quantification from untreated mice was not determined as all villus tips from these mice contained BrdU+ cells. (D) p53 was immunoprecipitated from Control (Con) or PACS-2 siRNA-treated HCT116 cells were treated with 0.5 µM Dox and analyzed by western blot. (E) Control (Con) or PACS-2 siRNA-treated HCT116 cells treated with 0.5 µM Dox (6hr) were analyzed by ChIP qPCR for the p21 promoter using antibodies specific for total p53 (DO-1) or Ac-p53 (K382). Error bars represent mean ± SEM from 3 independent experiments. Statistical significance determined using Student’s t-test. NS, not significant. See also Figure S3.
Figure 3
Figure 3. PACS-2 interacts with SIRT1 in the nucleus
(A) PACS-2-FLAG was immunoprecipitated from HCT116 cells and co-precipitating SIRT1-V5 or p300-HA was detected by western blot. (B) HCT116 cells treated with 0.5 µM Dox (3hr) as indicated were immunoprecipitated with control IgG, anti-PACS-2 (top) or anti-SIRT1 (bottom) and co-precipitating SIRT1 (top) or PACS-2 (bottom) detected by western blot. (C) Left: U2OS cells expressing eGFP-PACS-1, mCherry-PACS-2, mCherry-PACS-2ΔNLS or mcherry C. elegans PACS (T18H9.7a) were treated with 40 nM LMB (3hr) and analyzed by deconvolution microscopy. Nuclei were stained with DAPI. Top right: Percent total cellular fluorescent protein signal in the nucleus was quantified. Error bars represent mean ± SD from >100 cells in 3 independent experiments. Bottom right: Alignment of the predicted NLS motif (https://www.predictprotein.org) fitting the consensus [PLV]K[RK]x[RK][RK][RK][PL] from human PACS-1 (sp|Q6VY07, gi|30089916) with human PACS-2 (sp|Q86VP3, gi|155029546), mouse PACS-1 (gi|54291704), mouse PACS-2 (kkqrrsiv, gi|124487181), chicken PACS-2 (gi|513196172), zebrafish PACS-2 (gi|170172595), amphioxous PACS (gi|229298623), Drosophila PACS (Krt95D, gi|24649488) and C. elegans PACS (T18H9.7a, gi|373219078). Consensus basic amino acid doublets are shaded. (D) HCT116 cells were treated or not with 0.5 µM Dox for 6 hr. PACS-2 in the nuclear and cytoplasmic fractions was detected by western blot. Error bars represent mean ± SD from 3 independent experiments. Statistical significance was determined using Student’s t-test. (E) U2OS cells expressing mCherry-PACS-2 or mCherry-PACS-2ΔNLS were treated with 100 µM Etoposide (3hr) and analyzed by confocal microscopy. Nuclei stained with DAPI. Bottom: Percent total cellular fluorescent protein signal in the nucleus was quantified. Error bars represent mean ± SD from >100 cells in 3 independent experiments. Scale bar, 10 µm.
Figure 4
Figure 4. PACS-2 regulates SIRT1-mediated deacetylation of p53 in vivo
(A) Control (Con) or PACS-2 siRNA-treated HCT116 cells were treated with 0.5 µM Dox (6hr) alone or with 0.5 µM TSA or 1 µM EX-527 and analyzed by western blot. (B) Control (Con) or PACS-2 siRNA-treated HCT116 cells were treated as in (A), total p53 immunoprecipitated with anti-p53 (DO-1) and Ac-p53 (K382) or total p53 (FL-393) detected by western blot. (C) HCT116 cells transfected with control (Con), PACS-2 or SIRT1 siRNAs were processed as in (B).
Figure 5
Figure 5. Inhibition of SIRT1 restores p21-dependent cell cycle arrest in PACS-2 knockdown cells
(A) Synchronized control (Con), PACS-2 or p21 siRNA-treated HCT116 cells were stimulated to re-enter the cell cycle with 10% FBS in the presence of 10 µM BrdU and then treated or not with 0.5 µM Dox (24hr) in the presence or absence of 10 µM EX-527 and processed for flow cytometry. Results are representative of 3 independent experiments. (B) Quantitation of cells from panel A arrested in G0/G1. Error bars represent mean ± SEM from 3 independent experiments. Statistical significance determined using Student’s t-test. (C) Lysates from panel A were analyzed for the indicated proteins by western blot. NS, not significant. See also Table S2.
Figure 6
Figure 6. Nuclear PACS-2 regulates the p53-SIRT1 interaction
(A) Total p53 was immunoprecipitated from HCT116 cells and Ac-p53 (K382) analyzed by western blot. (B) Endogenous SIRT1 was immunoprecipitated from HCT116 WT or p53−/− cells treated with 0.5 µM Dox (6hr) as indicated and co-precipitating p53 analyzed by western blot. (C) HCT116 cells were treated with 0.5 µM Dox (14hr), endogenous SIRT1 immunoprecipitated and co-precipitating p53 analyzed by western blot. p53 was quantified using AlphaView (Protein Simple).
Figure 7
Figure 7. PACS-2 inhibits SIRT1-mediated deacetylation of p53 in vitro
(A) Top: Schematic of hPACS-2 and the predicted NLS (above) and NES (below). Bottom: Full length His6-SIRT1Δ6–83 was incubated with GST or GST-PACS-2 constructs and interacting His6-SIRT1Δ6–83 was detected by western blot. Captured GST fusion proteins detected with Ponceau S. (B) Top: Schematic of mSIRT1. Bottom: His6-PACS-2FBR was incubated with GST or GST-SIRT1 constructs and interacting His6-PACS-2FBR was detected by western blot as in (A). (C) GST-Ac-p53 (see Methods) was incubated with 0.5 µM NAD+ and His6-tagged SIRT1 or SIRT1-ΔNT together with increasing amounts of His6-PACS-2FBR as indicated. The amount of Ac-p53 (K382) was quantified and presented as percent acetylation. Error bars represent mean ± SEM from 4 independent experiments. (D) GST- Ac-p53 was incubated with 0.5 µM NAD+ and His6-SIRT1 together with increasing amounts of His6-PACS-1 or PACS-2 as indicated. The amount of Ac-p53 (K382) was quantified as in (C). See also Figure S4.

References

    1. Abbas T, Dutta A. p21 in cancer: intricate networks and multiple activities. Nature Rev Cancer. 2009;9:400–414. - PMC - PubMed
    1. Aslan JE, You H, Williamson DM, Endig J, Youker RT, Thomas L, Shu H, Du Y, Milewski RL, Brush MH, et al. Akt and 14-3-3 control a PACS-2 homeostatic switch that integrates membrane traffic with TRAIL-induced apoptosis. Mol Cell. 2009;34:497–509. - PMC - PubMed
    1. Atkins KM, Thomas L, Youker RT, Harriff MJ, Pissani F, You H, Thomas G. HIV-1 Nef binds PACS-2 to assemble a multikinase cascade that triggers major histocompatibility complex class I (MHC-I) down-regulation: analysis using short interfering RNA and knock-out mice. J Biol Chem. 2008;283:11772–11784. - PMC - PubMed
    1. Baptiste-Okoh N, Barsotti AM, Prives C. Caspase 2 is both required for p53-mediated apoptosis and downregulated by p53 in a p21-dependent manner. Cell Cycle. 2008;7:1133–1138. - PubMed
    1. Betz C, Stracka D, Prescianotto-Baschong C, Frieden M, Demaurex N, Hall MN. Feature Article: mTOR complex 2-Akt signaling at mitochondria-associated endoplasmic reticulum membranes (MAM) regulates mitochondrial physiology. Proc Natl Acad Sci USA. 2013;110:12526–12534. - PMC - PubMed

Publication types

MeSH terms